Chart USD Index DXY Update: Drifting lower
Anticipated selling interest has led to a drift lower to congestion support at 99.50
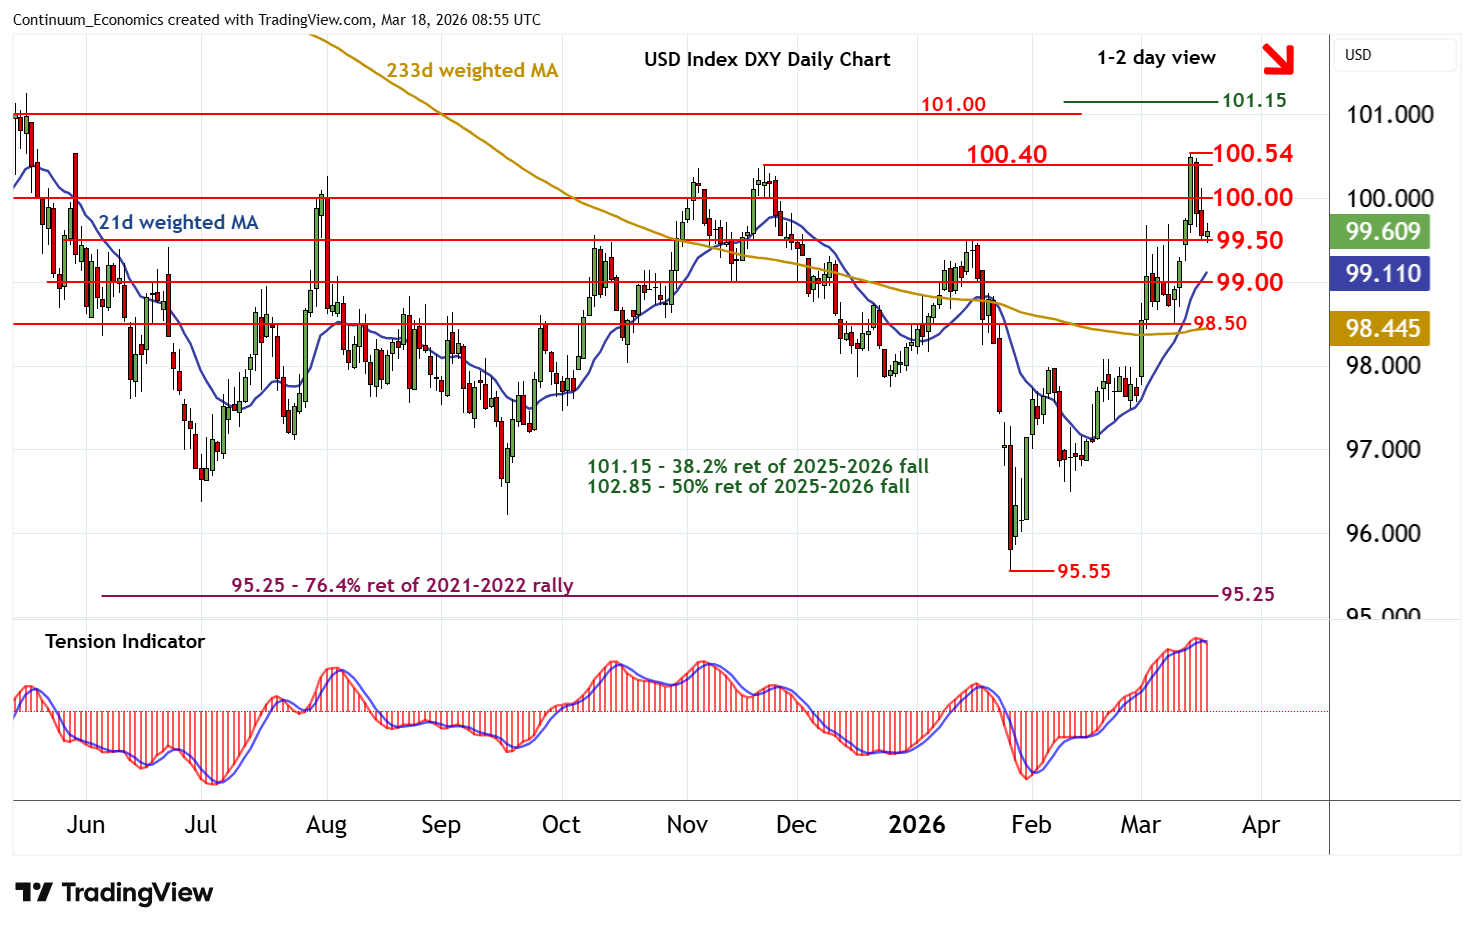
| Levels | Imp | Comment | Levels | Imp | Comment | |||
|---|---|---|---|---|---|---|---|---|
| R4 | 101.15 | ** | 38.2% ret of 2025-2026 fall | S1 | 99.50 | * | congestion | |
| R3 | 101.00 | * | congestion | S2 | 99.00 | ** | congestion | |
| R2 | 100.40/54 | ** | 21 Nov (m); 13 Mar YTD highs | S3 | 98.50 | * | congestion | |
| R1 | 100.00 | ** | congestion | S4 | 98.00 | * | congestion |
Asterisk denotes strength of level
08:45 GMT - Anticipated selling interest has led to a drift lower to congestion support at 99.50, where flat oversold intraday studies are prompting consolidation. Daily stochastics are falling and the daily positive daily Tension Indicator is turning down, highlighting room for further losses in the coming sessions. A break below 99.50 will open up further congestion around 99.00. But rising weekly charts and improving longer-term readings should limit any initial tests in renewed buying interest/consolidation. Following cautious/corrective trade, fresh gains are looked for. A close above congestion resistance at 100.00 will help to stabilise price action. But a further close above above 100.40/54 is needed to turn sentiment positive and confirm continuation of late-January gains, initially towards resistance at congestion around 101.00 and the 101.15 multi-month Fibonacci retracement.