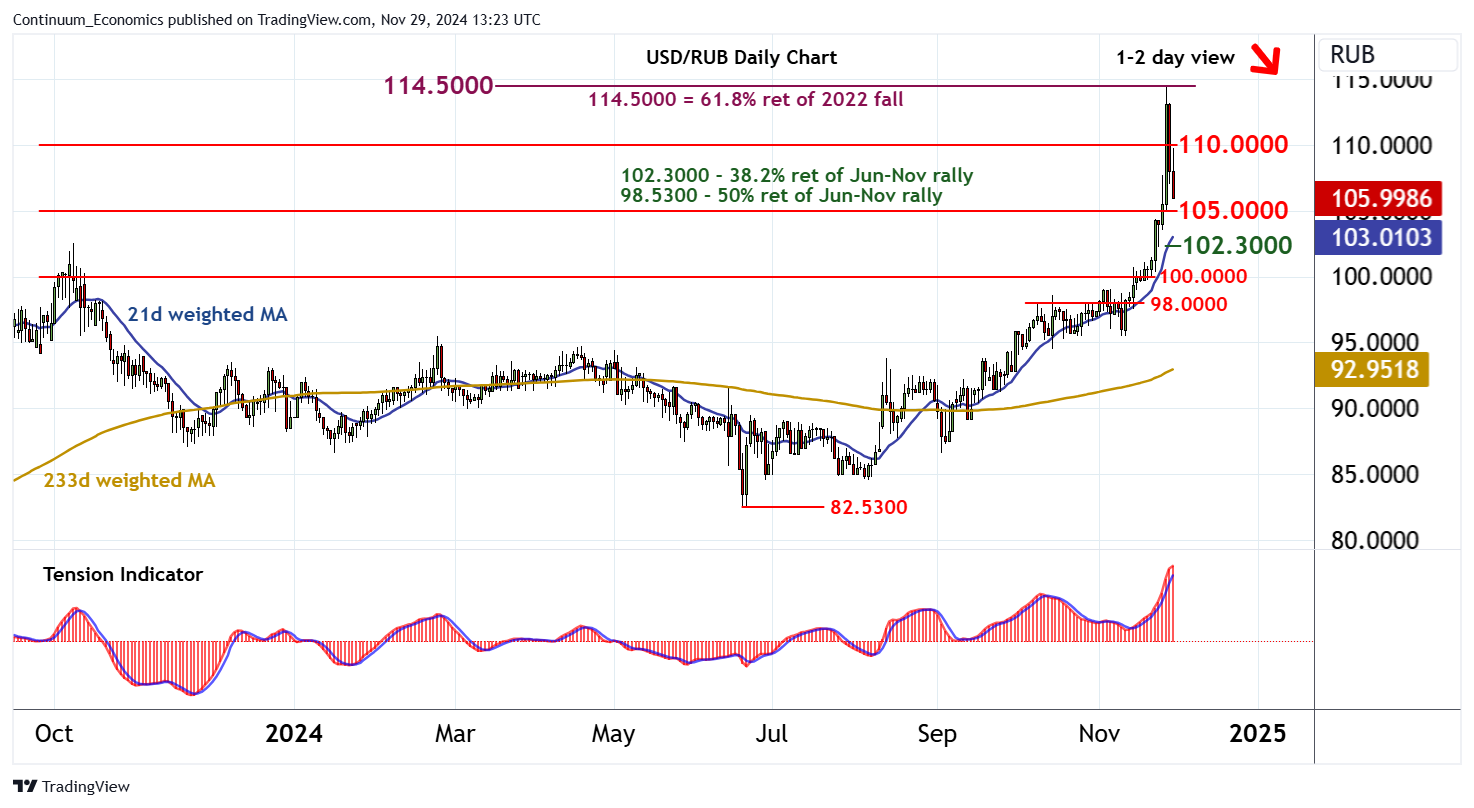
Chart USD/RUB Update: Lower in position adjustments

The anticipated break higher has met expected selling interest around the 114.5000 Fibonacci retracement

| Levels | Comment | Levels | Comment | |||||
| R4 | 115.0000 | ** | figure | S1 | 105.0000 | * | figure | |
| R3 | 114.5325 | ** | 27 Nov YTD high | S2 | 102.3000 | ** | 38.2% ret of Jun-Nov rally | |
| R2 | 114.5000 | ** | 61.8% ret of 2022 fall | S3 | 100.0000 | ** | congestion | |
| R1 | 110.0000 | ** | historic congestion | S4 | 98.5300 | ** | 50% ret of Jun-Nov rally |
Asterisk denotes strength of level
12:55 GMT - The anticipated break higher has met expected selling interest around the 114.5000 Fibonacci retracement, with prices falling sharply towards 105.0000. Overbought daily stochastics are unwinding and the positive daily Tension Indicator is flattening, suggesting potential for a break beneath here. But rising weekly charts are expected to limit initial scope in consolidation above the 102.3000 Fibonacci retracement. A further close beneath here, however, will add weight to sentiment and open up 100.0000. Meanwhile, resistance is lowered to 110.0000. But a close above critical resistance at the 114.5000 Fibonacci retracement and the 114.5325 current year high of 27 November is needed to turn sentiment positive once again and confirm continuation of broad June 2022 gains.