Published: 2026-02-25T07:17:52.000Z
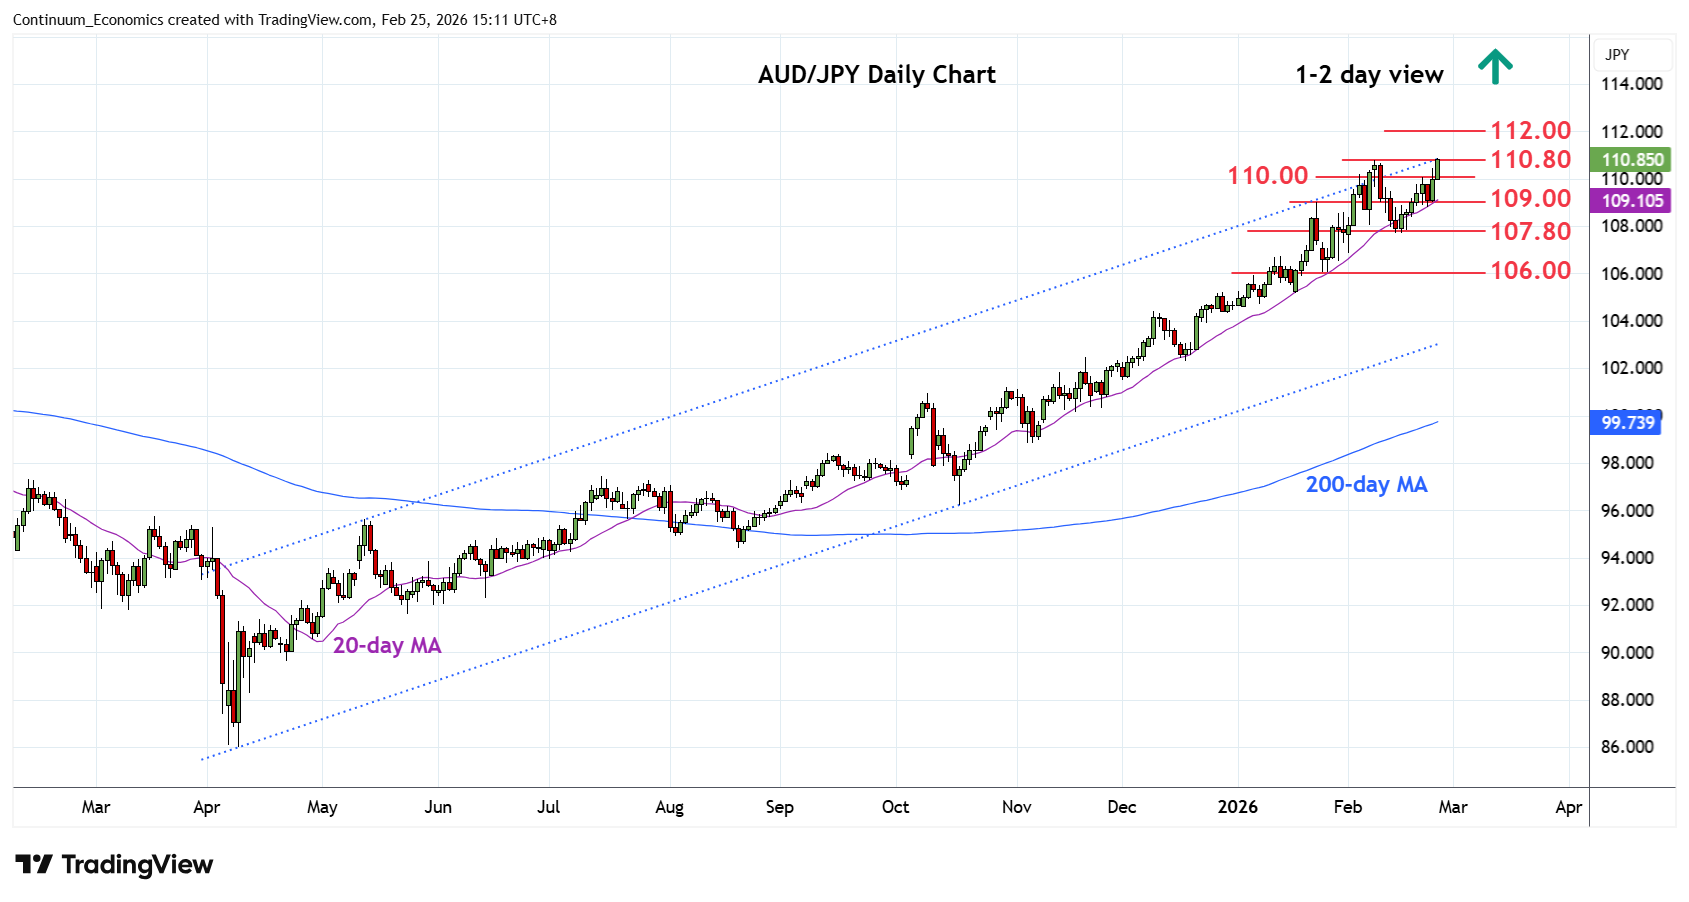
Chart AUD/JPY Update: Retest 110.80 high
1
Consolidation below the 110.00 level has given way to break to retest the 110.80, 9 February current year high
| Levels | Imp | Comment | Levels | Imp | Comment | |||
|---|---|---|---|---|---|---|---|---|
| R4 | 114.00 | * | congestion | S1 | 109.00 | ** | Jan high, congestion | |
| R3 | 113.00 | * | congestion | S2 | 108.00 | * | congestion | |
| R2 | 112.00 | ** | congestion | S3 | 107.80 | ** | congestion, 2007 high | |
| R1 | 110.80 | ** | 9 Feb YTD high | S4 | 106.70 | * | 14 Jan high |
Asterisk denotes strength of level
07:10 GMT - Consolidation below the 110.00 level has given way to break to retest the 110.80, 9 February current year high. Bullish structure suggest scope for break here to extend the broader gains from the 2020 year low and see room to the 112.00/113.00 congestion area. However, overbought daily and weekly studies caution corrective pullback with support now raised to the 109.00, January high which should underpin. Break here needed to open up room for deeper pullback to the strong support at the 108.00/107.80 area.