Published: 2026-01-13T09:17:16.000Z
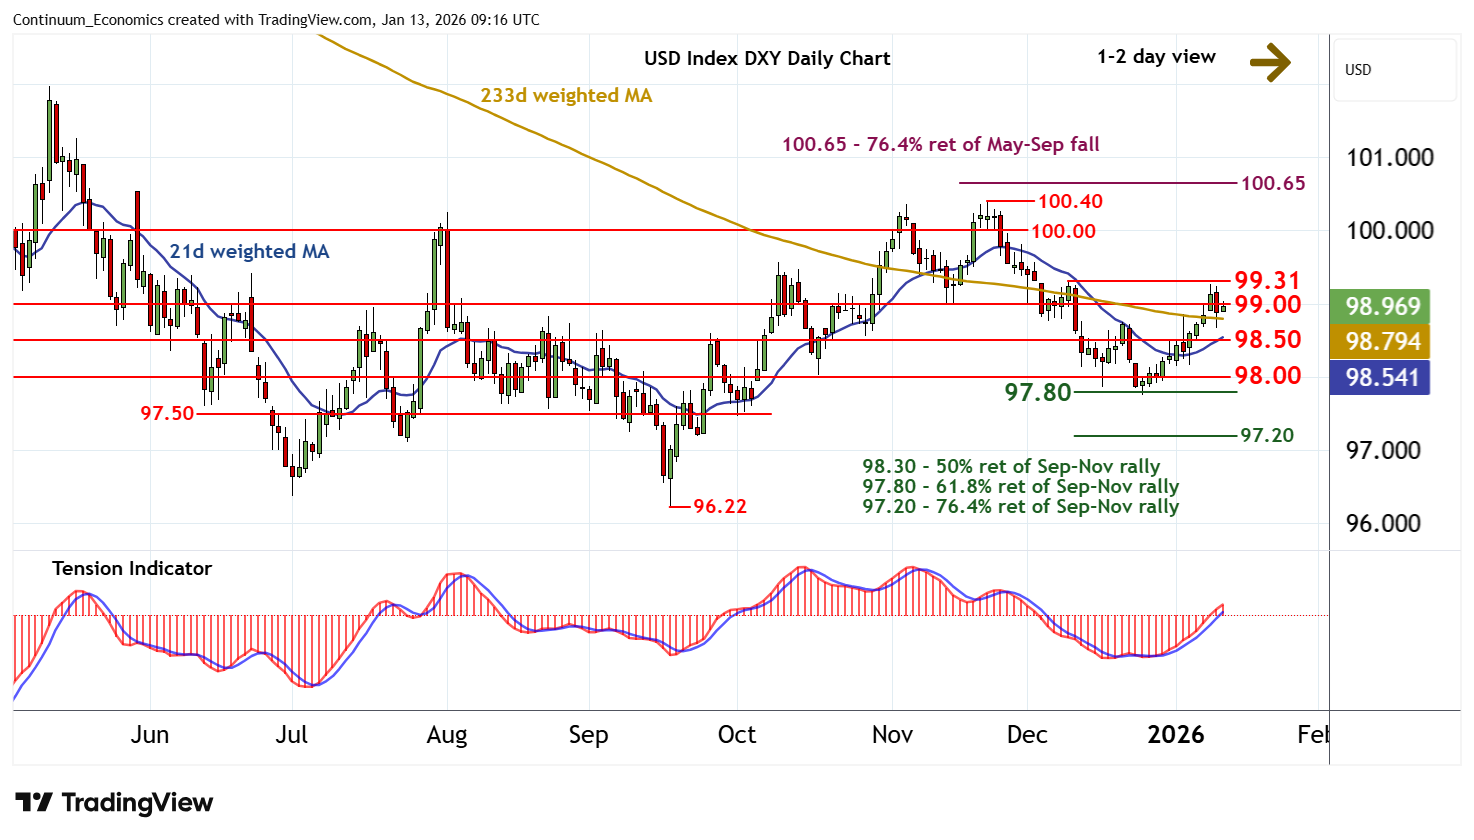
Chart USD Index DXY Update: Cautious trade
-
The anticipated test of congestion support at 98.50 has not been seen
| Levels | Imp | Comment | Levels | Imp | Comment | |||
|---|---|---|---|---|---|---|---|---|
| R4 | 100.40 | ** | 21 Nov (m) high | S1 | 98.50 | * | congestion | |
| R3 | 100.00 | ** | congestion | S2 | 98.00 | * | congestion | |
| R2 | 99.26/31 | * | 9 Jan; 9 Dec (w) highs | S3 | 97.80 | ** | 61.8% ret of Sep-Nov rally | |
| R1 | 99.00 | * | congestion | S4 | 97.50 | congestion |
Asterisk denotes strength of level
09:10 GMT - The anticipated test of congestion support at 98.50 has not been seen, as prices post a bounce from 98.67 to pressure congestion resistance at 99.00. Rising intraday studies and the positive daily Tension Indicator highlight room for a test above here. But unwinding overbought daily stochastics and mixed weekly charts should limit scope in renewed selling interest towards strong resistance at 99.26/31. In the coming sessions, consolidation is looked for, with any immediate setbacks to be limited in consolidation above 98.50.