Chart GBP/USD Update: Under pressure
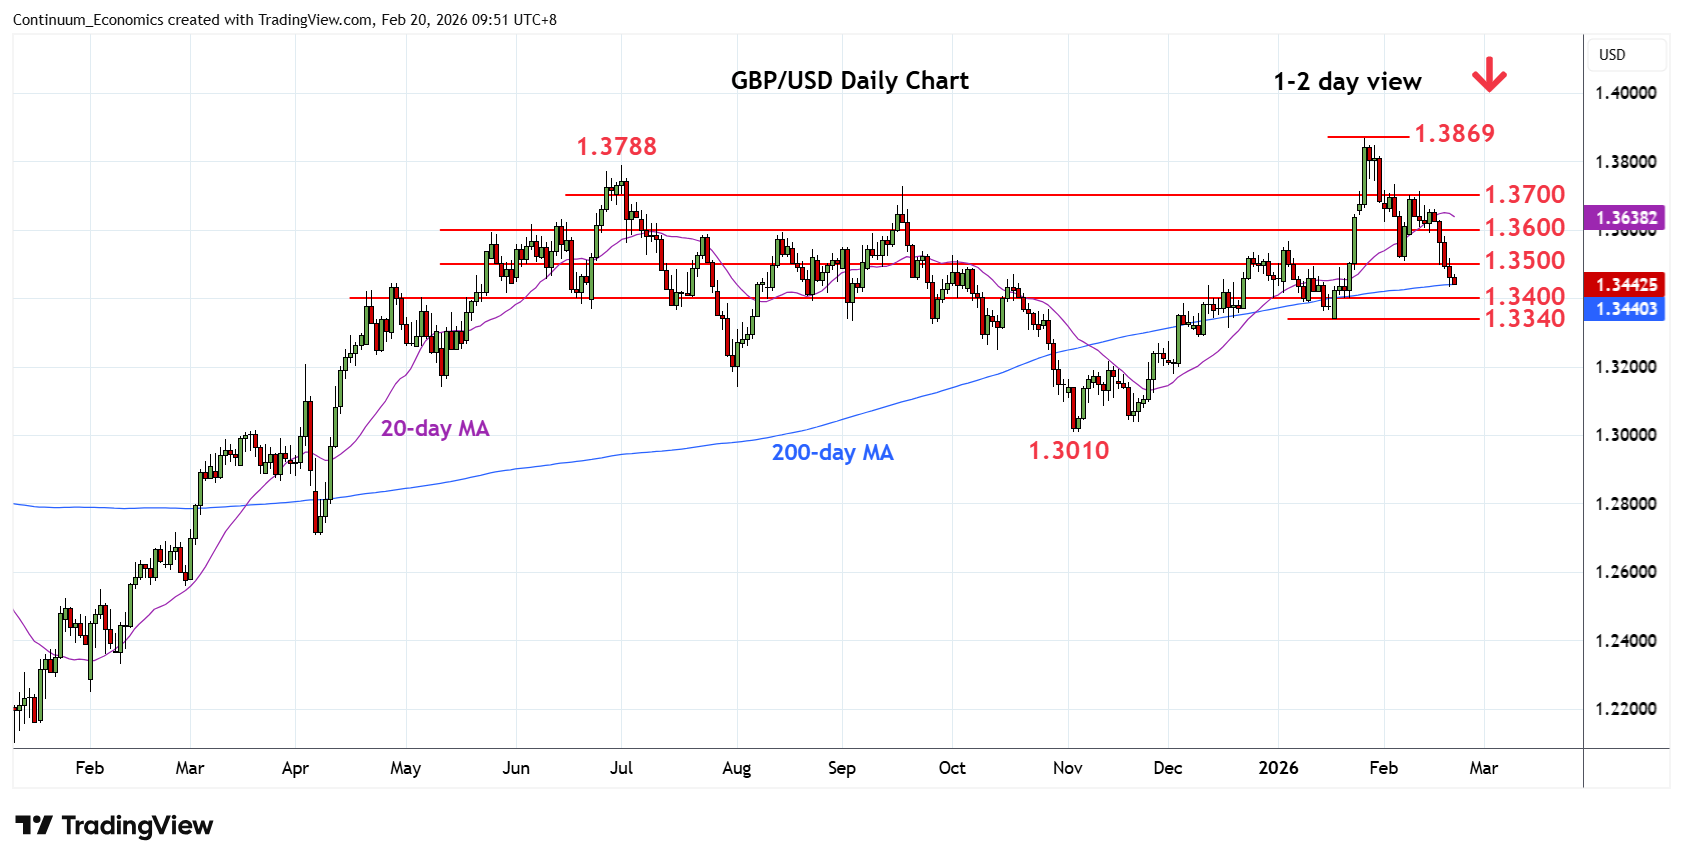
Break of the 1.3508/00 support see prices extending losses from the 1.3869 January current year high to reach 1.3440 support
| Level | Comment | Level | Comment | |||||
|---|---|---|---|---|---|---|---|---|
| R4 | 1.3700 | * | congestion | S1 | 1.3440 | * | 50% Nov/Jan rally | |
| R3 | 1.3600/20 | ** | congestion | S2 | 1.3400 | * | congestion | |
| R2 | 1.3568 | * | 6 Jan high | S3 | 1.3340 | ** | 19 Jan YTD low, 61.8% | |
| R1 | 1.3500 | * | congestion | S4 | 1.3300 | * | congestion |
Asterisk denotes strength of level
01:50 GMT - Break of the 1.3508/00 support see prices extending losses from the 1.3869 January current year high to reach 1.3440, 50% Fibonacci level and 200-day MA. However, pressure remains on the downside and break here cannot be ruled out. Lower will see room for extension to the 1.3400 congestion then the 1.3340, 19 January YTD low and 61.8% Fibonacci level. Meanwhile, resistance is lowered to the 1.3500/08 congestion and 6 February low which is expected to cap. Regaining this is needed fade the downside pressure and open up room for retest of resistance at 1.3568 and 1.3600 congestion.