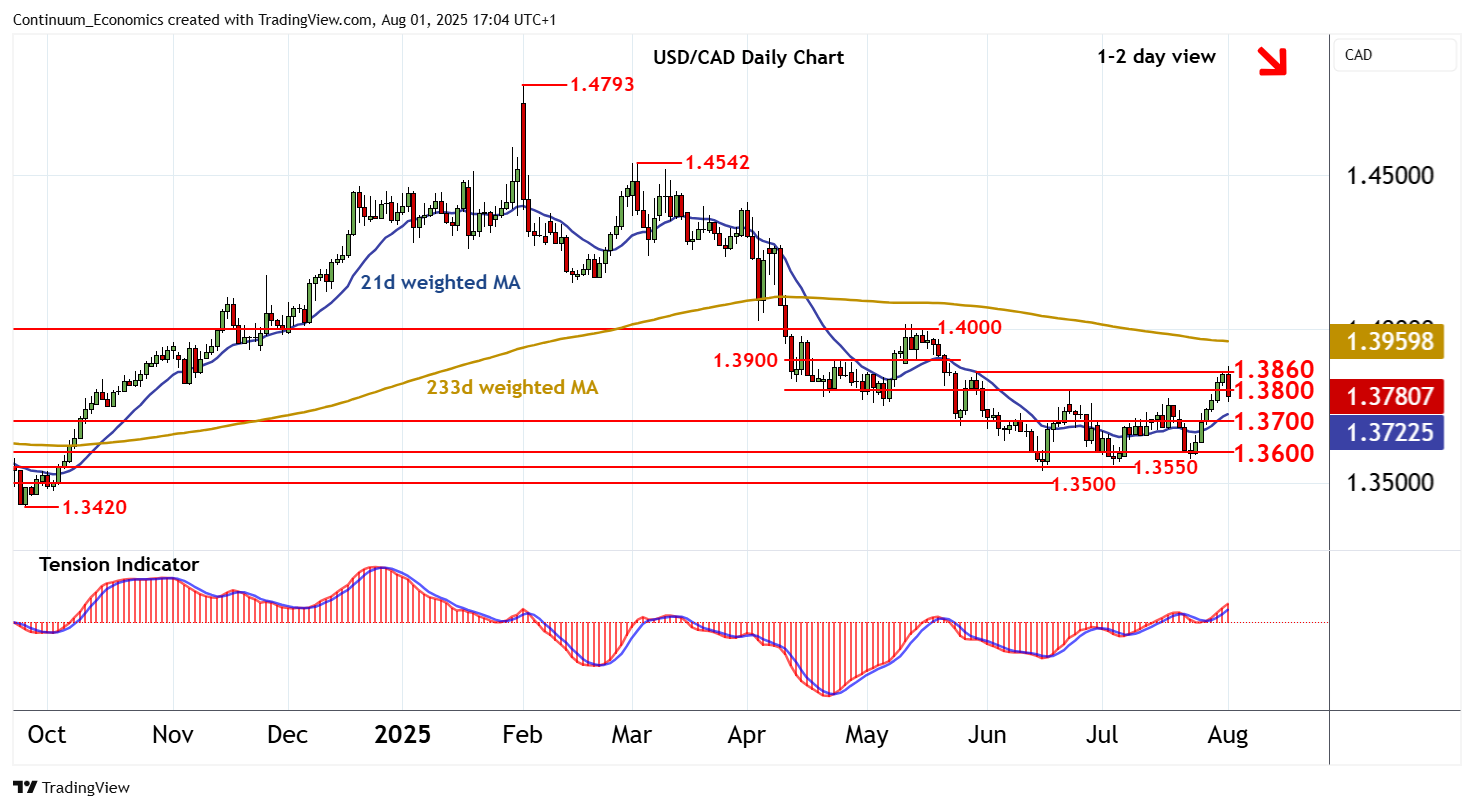
Chart USD/CAD Update: Sharp pullback in both USD- and CAD-driven trade

The anticipated test of resistance at the 1.3860 weekly high of 29 May has given way to a sharp pullback
| Levels | Imp | Comment | Levels | Imp | Comment | |||
|---|---|---|---|---|---|---|---|---|
| R4 | 1.4000 | ** | break level | S1 | 1.3700 | ** | congestion | |
| R3 | 1.3900 | * | break level | S2 | 1.3600 | ** | congestion | |
| R2 | 1.3860 | * | 29 May (w) high | S3 | 1.3550 | * | congestion | |
| R1 | 1.3800 | * | congestion | S4 | 1.3540 | ** | 16 Jun YTD low |
Asterisk denotes strength of level
16:40 BST - The anticipated test of resistance at the 1.3860 weekly high of 29 May has given way to a sharp pullback in both USD- and CAD-driven trade, with the break below 1.3800 reaching 1.3765. Intraday studies are falling, unwinding negative divergence, and overbought daily stochastics are also turning down, highlighting a deterioration in sentiment and room for deeper losses in the coming sessions. Focus is expected to turn to congestion support at 1.3700. However, rising weekly charts should limit any initial break in renewed buying interest/consolidation above further congestion around 1.3600. Meanwhile, a close above 1.3860 is needed to turn sentiment positive and confirm continuation of June gains, initially to 1.3900.