Published: 2025-05-02T07:38:30.000Z
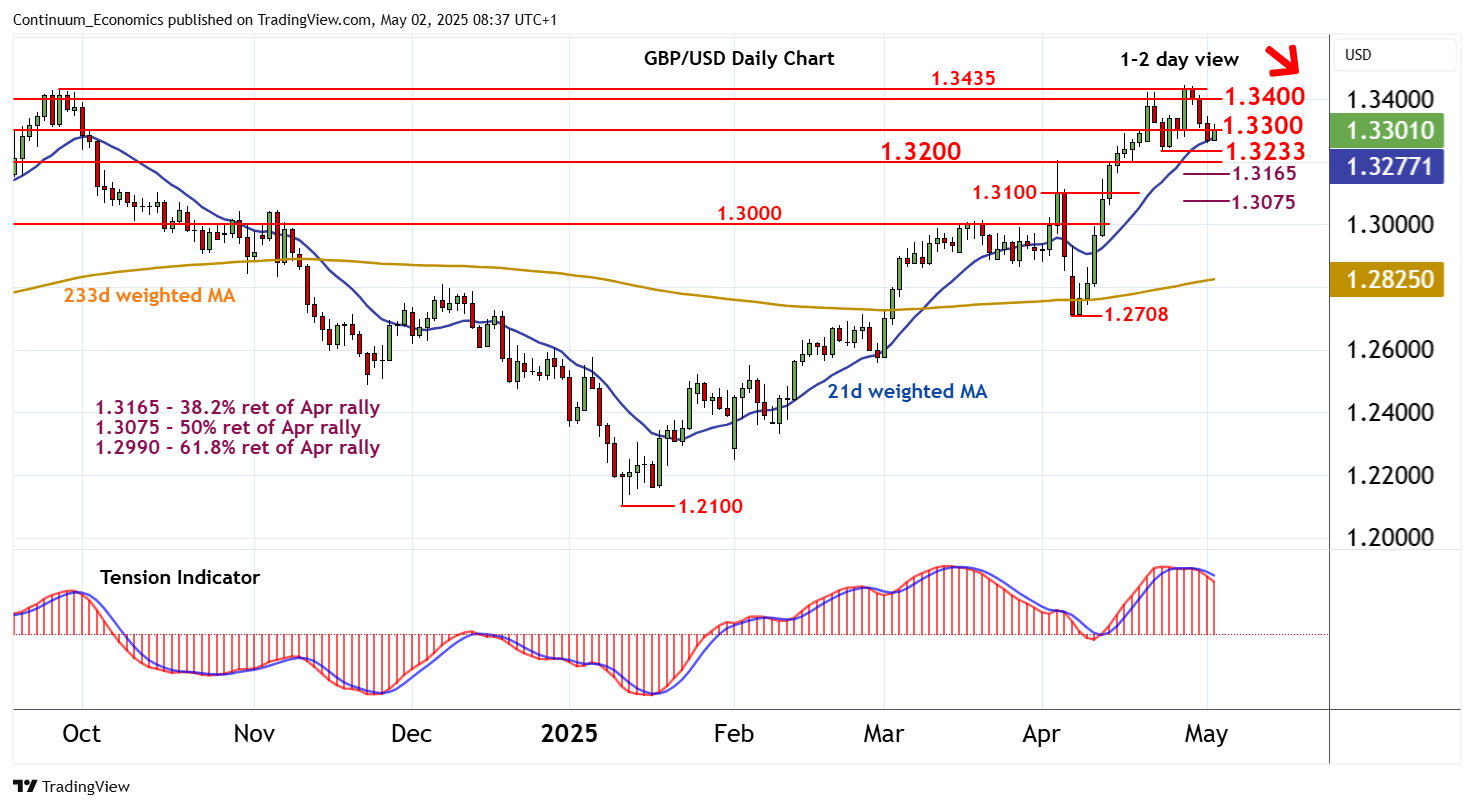
Chart GBP/USD Update: Consolidating losses - studies under pressure

Senior Technical Strategist
4
Prices have bounced from 1.3260
| Level | Comment | Level | Comment | |||||
|---|---|---|---|---|---|---|---|---|
| R4 | 1.3500 | ** | congestion | S1 | 1.3233 | * | 23 Apr (w) low | |
| R3 | 1.3435 | ** | 26 Sep 2024 (y) high | S2 | 1.3200 | ** | break level | |
| R2 | 1.3400 | congestion | S3 | 1.3165 | ** | 38.2% ret of Apr rally | ||
| R1 | 1.3300 | break level | S4 | 1.3100 | congestion |
Asterisk denotes strength of level
08:10 BST - Prices have bounced from 1.3260, as oversold intraday studies turn higher, unwinding positive divergence, with prices currently balanced around resistance at 1.3300. A test above here cannot be ruled out. But negative daily readings and flat overbought weekly stochastics are expected to limit scope in renewed selling interest beneath congestion around 1.3400. In the coming sessions, fresh losses are looked for. A later close below the 1.3233 weekly low of 23 April will add weight to sentiment and confirm a near-term top in place around the 1.3435 year high of 26 September 2024, as the 1.3165 Fibonacci retracement then attracts.