Chart GBP/USD Update: Edging higher

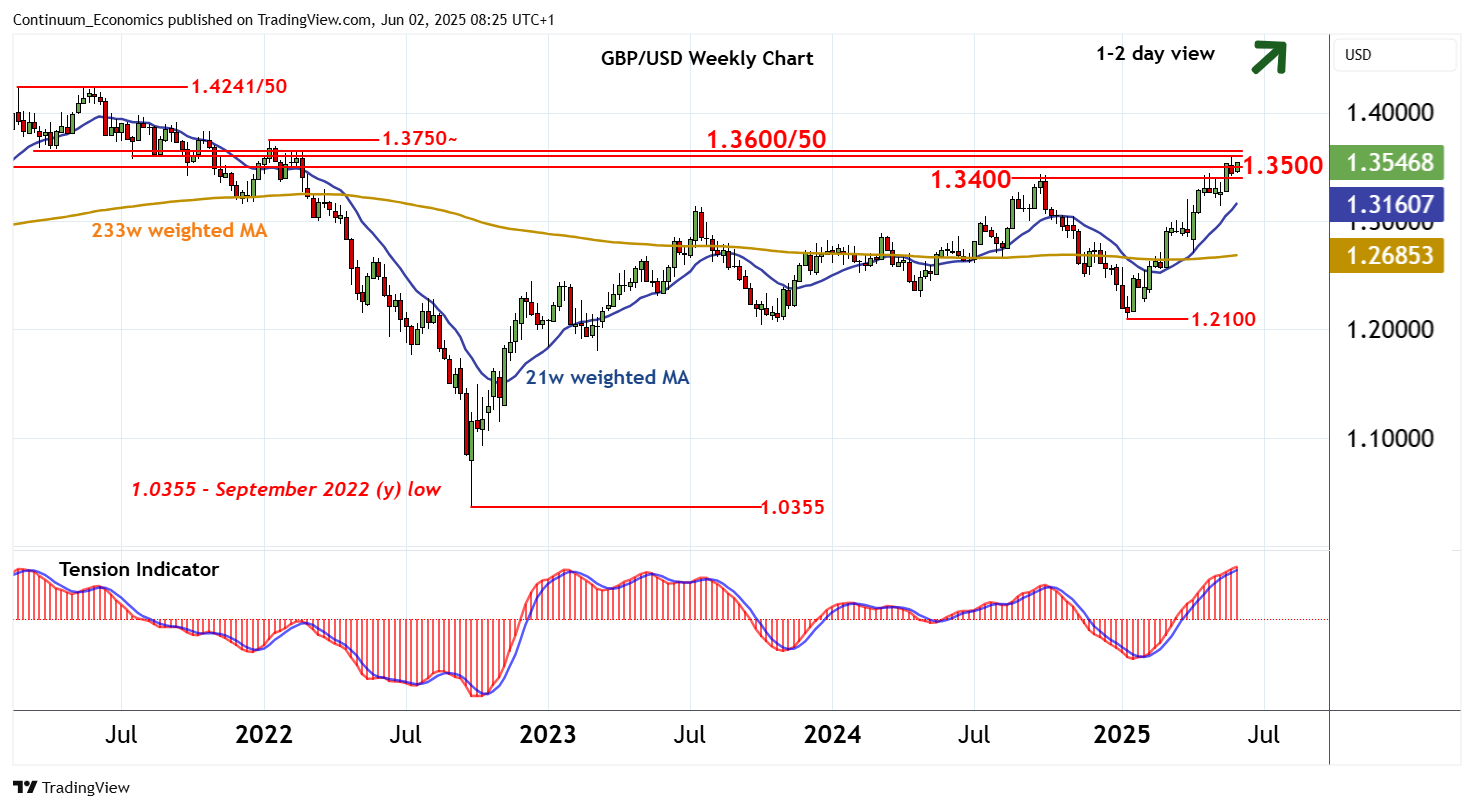
Cautious trade has given way to a sharp break above 1.3500
| Level | Comment | Level | Comment | |||||
|---|---|---|---|---|---|---|---|---|
| R4 | 1.3800 | ** | congestion | S1 | 1.3500 | ** | congestion | |
| R3 | 1.3750~ | ** | January 2022 (y) high | S2 | 1.3400 | congestion | ||
| R2 | 1.3650 | * | congestion | S3 | 1.3300 | break level | ||
| R1 | 1.3593/00 | ** | 26 May YTD high; cong | S4 | 1.3250~ | * | range lows |
Asterisk denotes strength of level
08:10 BST - Cautious trade has given way to a sharp break above 1.3500, with prices currently trading around 1.3545. Intraday studies have ticked up and negative daily stochastics are flattening, suggesting potential for a test of strong resistance at the 1.3593 current year high of 26 May and congestion around 1.3600. Intraday studies are already overbought and the daily Tension Indicator is leaning lower, suggesting any immediate tests could give way to consolidation. However, longer-term charts are rising, pointing to potential for a later break and continuation of September 2022 gains, initially to congestion around 1.3650. Meanwhile, a break back below 1.3500, if seen, will turn sentiment cautious once again and give way to consolidation above further congestion around 1.3400.