Published: 2025-02-21T03:04:43.000Z
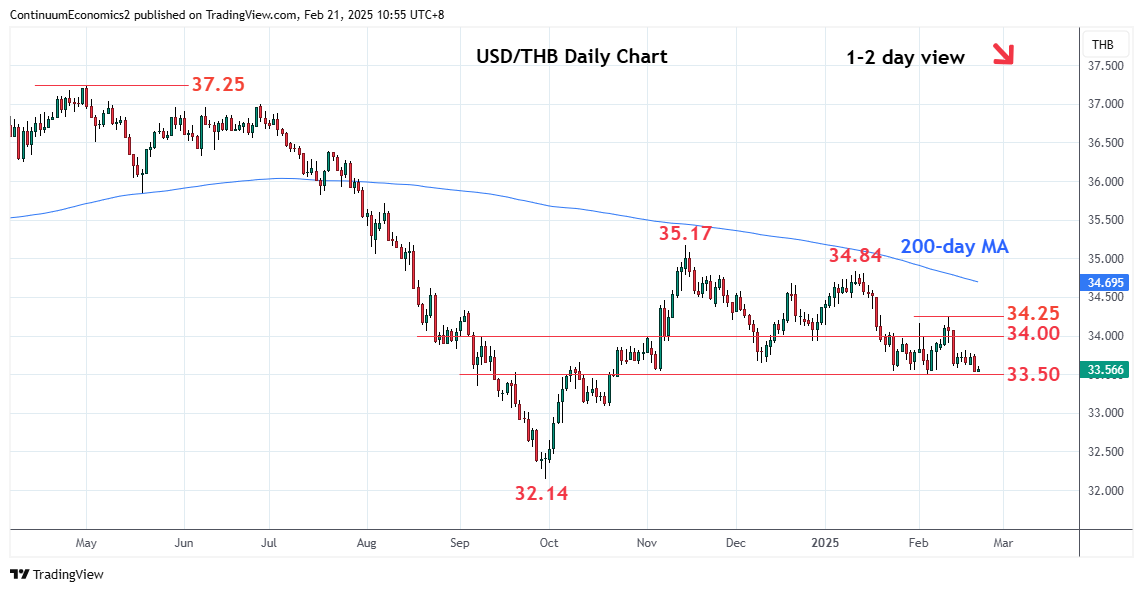
Chart USD/THB Update: Under pressure, 33.50 low at risk

Technical Analyst
-
Consolidation above the 33.58 low of last week has given way to break to expose the 33.50 current year low to retest
| Level | Comment | Level | Comment | |||||
|---|---|---|---|---|---|---|---|---|
| R4 | 34.35 | * | 17 Jan low | S1 | 33.50 | ** | 5 Feb YTD low | |
| R3 | 34.25 | ** | 12 Jan high | S2 | 33.30 | * | 61.8% Sep/Nov rally | |
| R2 | 34.00 | * | congestion | S3 | 33.08 | * | 18 Oct low | |
| R1 | 33.82 | * | 18 Feb high | S4 | 33.00 | * | congestion |
Asterisk denotes strength of level
03:00 GMT - Consolidation above the 33.58 low of last week has given way to break to expose the 33.50 current year low to retest. Break here will extend the broader losses from the 35.17 high of November to retrace rally from the September low and see room to 33.30, 61.8% Fibonacci level. Lower still will see scope to the 33.08 support and the 33.00 level. Meanwhile, resistance is lowered to the 33.82 bounce high. This and the 34.00 congestion should now cap and limit corrective bounce and sustain losses from the 34.25 high of last week.