Chart USD/CAD Update: Reached 1.3800
The anticipated test of congestion resistance at 1.3800 has met sharp selling interest
| Levels | Imp | Comment | Levels | Imp | Comment | |||
|---|---|---|---|---|---|---|---|---|
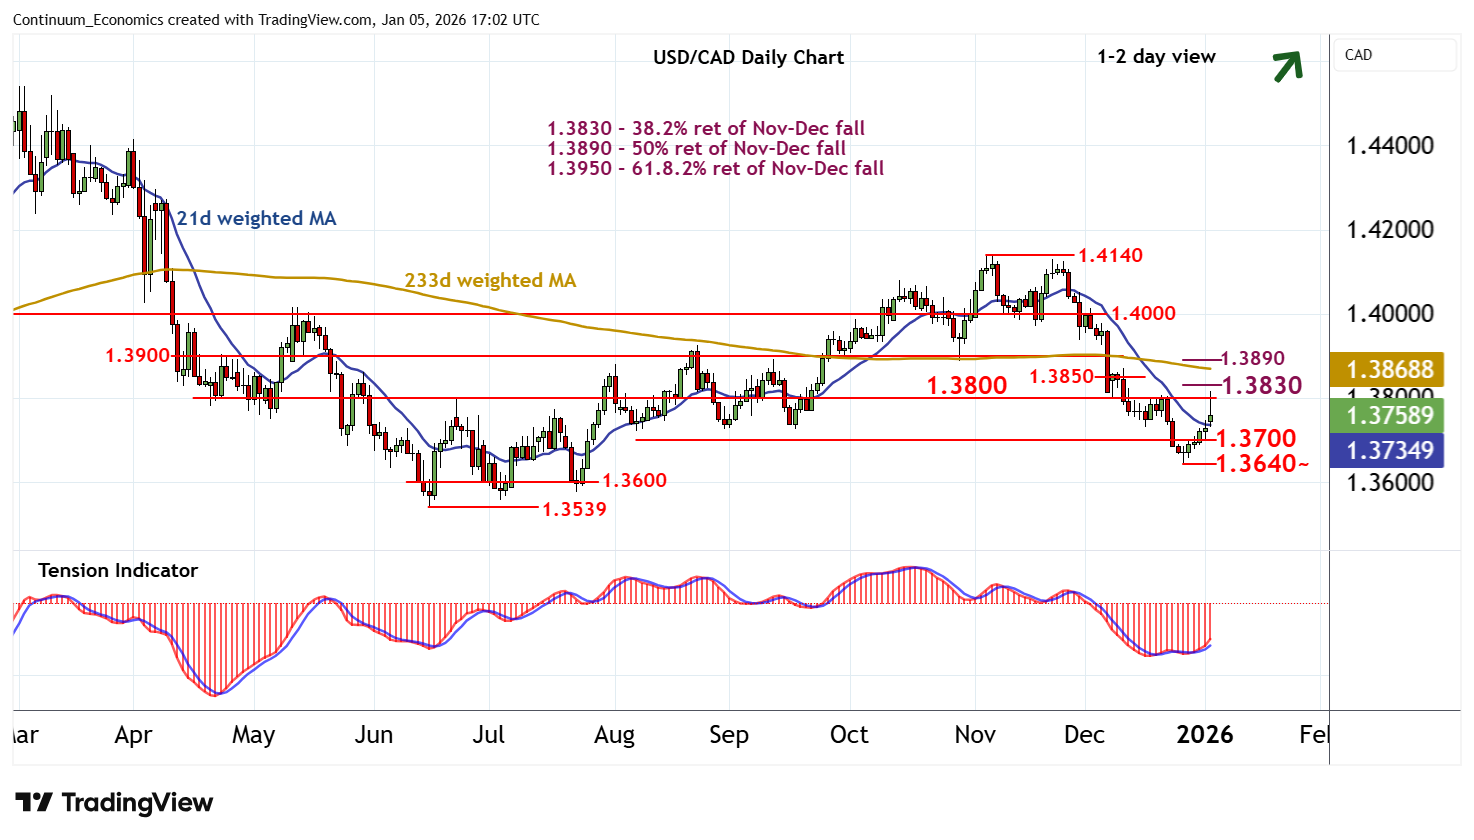
| R4 | 1.3890/00 | ** | 50% ret; break level | S1 | 1.3700 | * | congestion | |
| R3 | 1.3850 | congestion | S2 | 1.3640 | * | 26 Dec (w) low | ||
| R2 | 1.3830 | * | 38.2% ret of Nov-Dec fall | S3 | 1.3600 | * | congestion | |
| R1 | 1.3800 | ** | congestion | S4 | 1.3539 | ** | 16 Jun YTD low |
Asterisk denotes strength of level
16:40 GMT - The anticipated test of congestion resistance at 1.3800 has met sharp selling interest, as overbought intraday studies unwind, with prices falling back to trade around 1.3750. Daily readings continue rise, highlighting room for a fresh test above 1.3800. But already overbought daily stochastics and mixed/negative weekly charts could prompt renewed selling interest towards the 1.3830 Fibonacci retracement. A close above here, however, would extend gains towards 1.3890/00, where more significant selling interest is expected to appear. Meanwhile, support is at congestion around 1.3700 and should underpin any immediate setbacks.