Chart USD/JPY Update: Leaning lower
Anticipated minor tests higher have not been seen
| Levels | Imp | Comment | Levels | Imp | Comment | |||
|---|---|---|---|---|---|---|---|---|
| R4 | 161.95 | ** | July 2024 (y) high | S1 | 158.00 | * | break level | |
| R3 | 160.00 | ** | congestion | S2 | 157.00 | congestion | ||
| R2 | 159.45 | * | 14 Jan YTD high | S3 | 156.00 | * | congestion | |
| R1 | 158.88 | ** | 10 January 2025 (y) high | S4 | 155.00 | * | break level |
Asterisk denotes strength of level
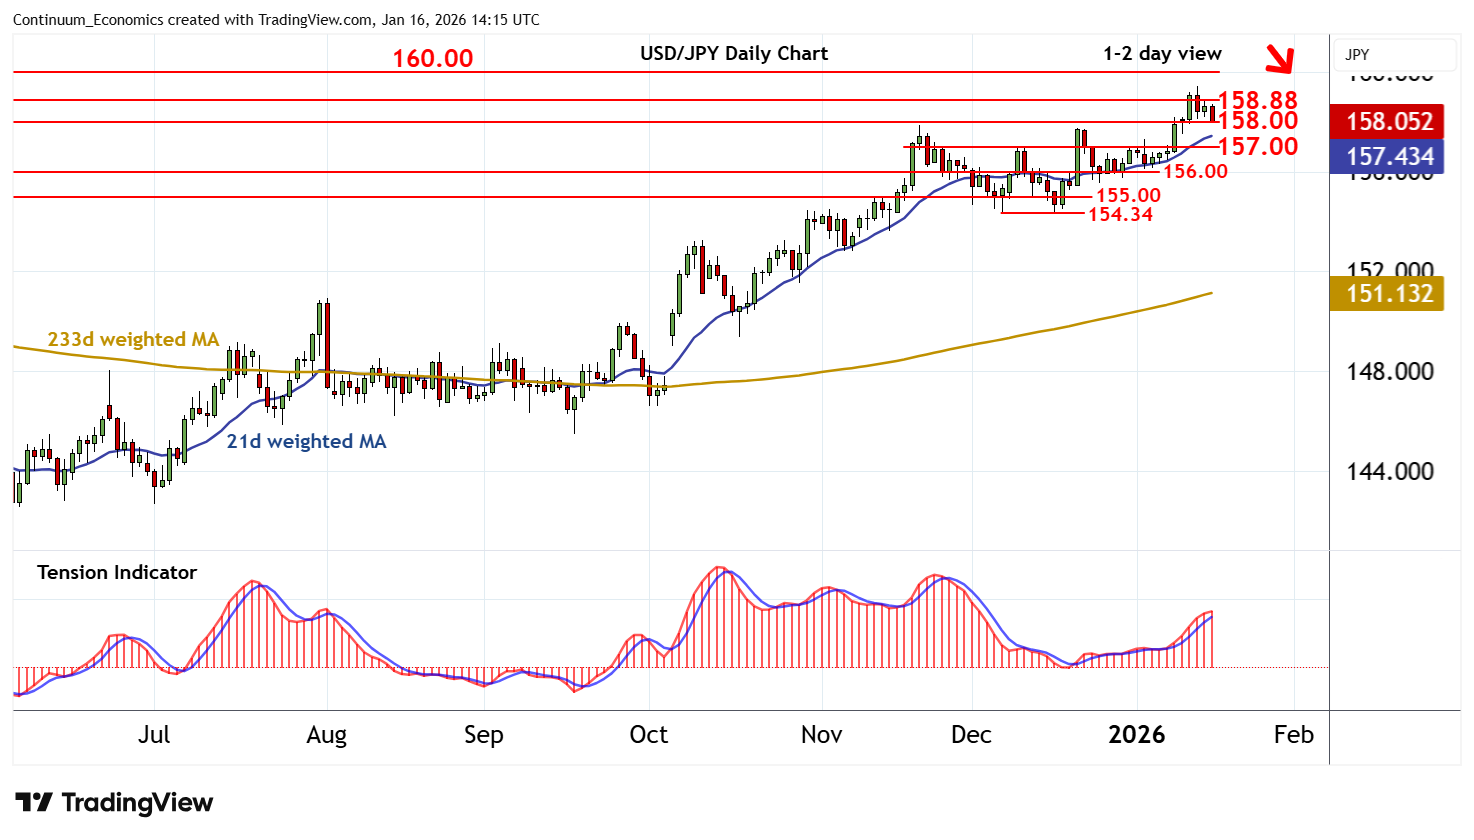
13:55 GMT - Anticipated minor tests higher have not been seen, as prices turn lower in both USD- and JPY-driven trade to pressure support at 158.00. Overbought daily stochastics are unwinding and the positive daily Tension Indicator is flattening, suggesting room for further losses in the coming sessions. A break below 158.00 will open up congestion support at 157.00. Beneath here is further congestion around 156.00, but mixed weekly charts could limit any initial tests in consolidation. Meanwhile, resistance remains at the 158.88 year high of 10 January 2025. However, a close above the 159.45 current year high of 14 January is needed to improve price action and extend September 2024 gains towards 160.00.