Published: 2025-07-04T05:32:11.000Z
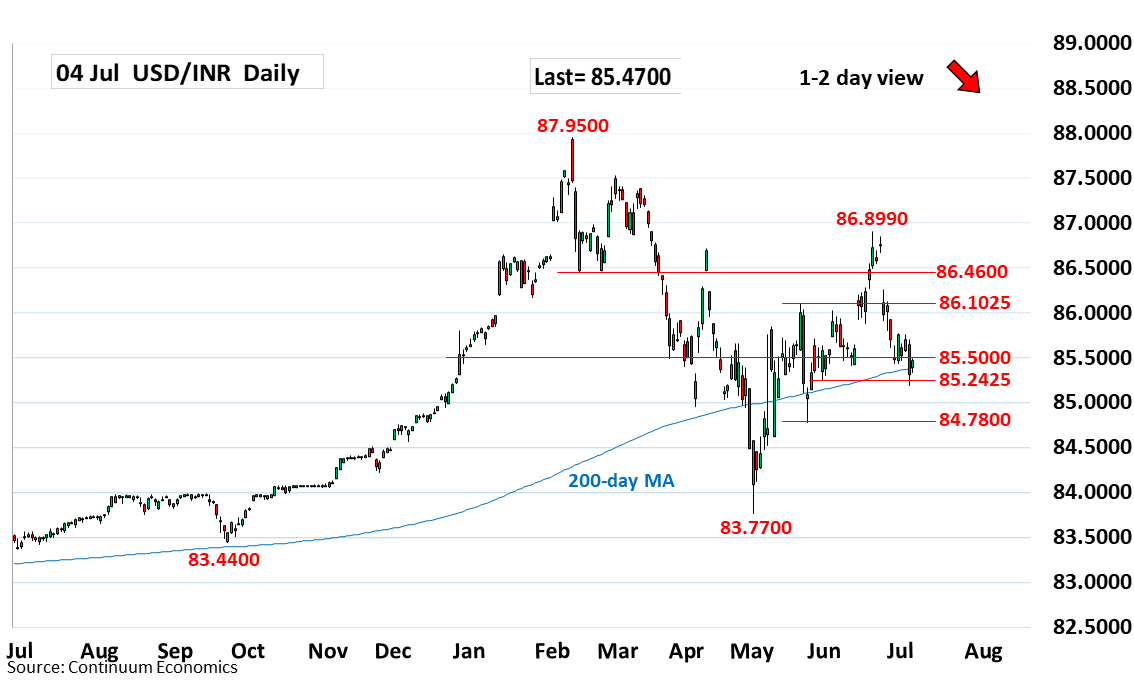
Chart USD/INR Update: Consolidating losses to 85.1900 low

Technical Analyst
-
Break of flag pattern has seen extension to reach 85.1900 low before turning up in consolidation
| Level | Comment | Level | Comment | |||||
|---|---|---|---|---|---|---|---|---|
| R4 | 86.4600 | ** | Feb low | S1 | 85.1900 | * | 3 Jun low | |
| R3 | 86.1025 | * | May high | S2 | 85.0000 | * | congestion | |
| R2 | 85.7700 | * | 30 Jun high | S3 | 84.7800 | ** | 26 May low | |
| R1 | 85.5000 | * | congestion | S4 | 84.5000 | * | congestion |
Asterisk denotes strength of level
05:30 GMT - Break of flag pattern has seen extension to reach 85.1900 low before turning up in consolidation to unwind oversold intraday studies. Daily studies are stretched as well and caution corrective bounce to retrace losses from the 86.8990, June high. Resistance is lowered to the resistance at the 85.5000 congestion then the 85.7700, 30 June high. Correction is expected to give way to renewed selling pressure later and below the 85.1900 low will see room to the 85.0000 congestion then the 84.7800, 26 May low.