Chart USD/ZAR Update: Spike higher not sustained in heightened volatility
Choppy trade has given way to a spike above resistance within the 17.0000 - 17.1200 range
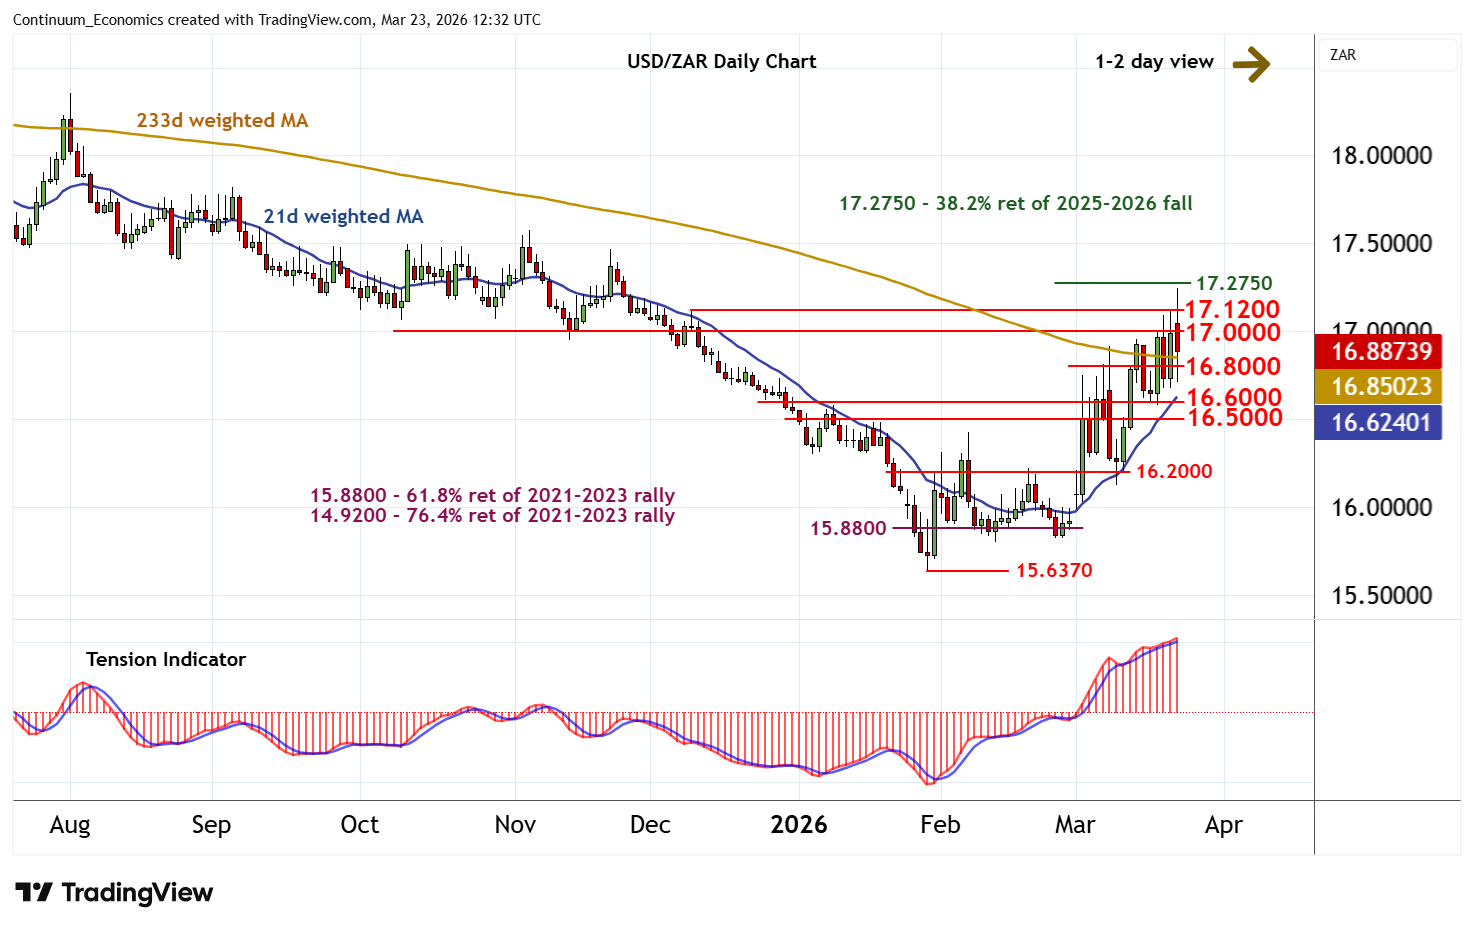
| Level | Comment | Level | Comment | |||||
|---|---|---|---|---|---|---|---|---|
| R4 | 17.5000 | ** | break level | S1 | 16.8000 | congestion | ||
| R3 | 17.2750 | ** | 38.2% ret of 2025-2026 fall | S2 | 16.6000 | break level | ||
| R2 | 17.1200 | * | 9 Dec (w) high | S3 | 16.5000 | break level | ||
| R1 | 17.0000 | * | congestion | S4 | 16.2000 | * | congestion |
Asterisk denotes strength of level
12:20 GMT - Choppy trade has given way to a spike above resistance within the 17.0000 - 17.1200 range, with prices meeting selling interest beneath the 17.2750 Fibonacci retracement. Intraday studies are under pressure and daily stochastics are falling, highlighting room for a fresh test of congestion support around 16.8000. A break back beneath here will open up support within the 16.5000 - 16.6000 range. But the positive daily Tension Indicator and rising weekly charts should limit any tests of here in fresh consolidation. Meanwhile, a close above 17.2750 would improve price action and extend late-January gains towards 17.5000.