Published: 2026-02-19T08:12:58.000Z
Chart EUR/AUD Update: Under pressure
1
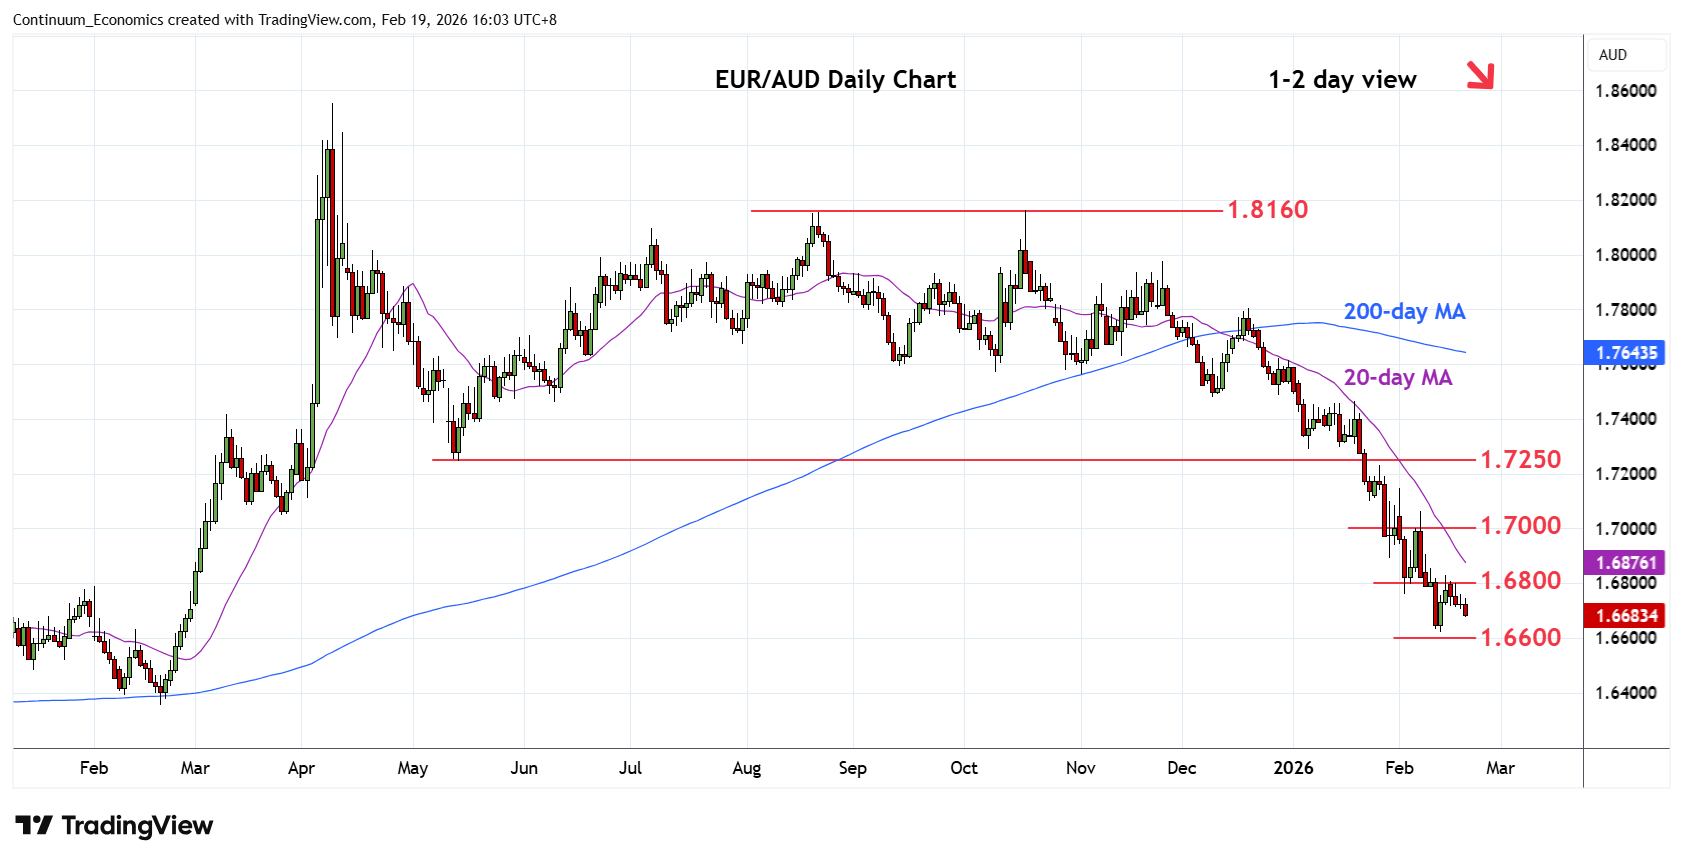
Failed to sustain bounce above the 1.6800 level as prices settled back from the 1.6830 high
| Levels | Imp | Comment | Levels | Imp | Comment | |||
|---|---|---|---|---|---|---|---|---|
| R4 | 1.7100 | * | 23 Jan low | S1 | 1.6600 | * | congestion | |
| R3 | 1.7000 | * | figure, congestion | S2 | 1.6500 | * | congestion | |
| R2 | 1.6900 | * | congestion | S3 | 1.6400 | * | figure, congestion | |
| R1 | 1.6800 | * | congestion | S4 | 1.6357 | ** | Feb 2025 year low |
Asterisk denotes strength of level
08:10 GMT - Failed to sustain bounce above the 1.6800 level as prices settled back from the 1.6830 high. Return below the 1.6700 level see the 1.6623 low and 1.6600 congestion back in focus and break here will extend the broader losses from the April 2025 year high. Lower will see continuation to support at the 1.6500 level then the 1.6400/1.6357 congestion and February 2025 year low. Meanwhile, resistance at the 1.6800/30 area expected to cap. Break here is needed to open up room for stronger bounce to retrace losses from the 1.8160, Ocotober high.