Published: 2025-06-05T10:50:54.000Z
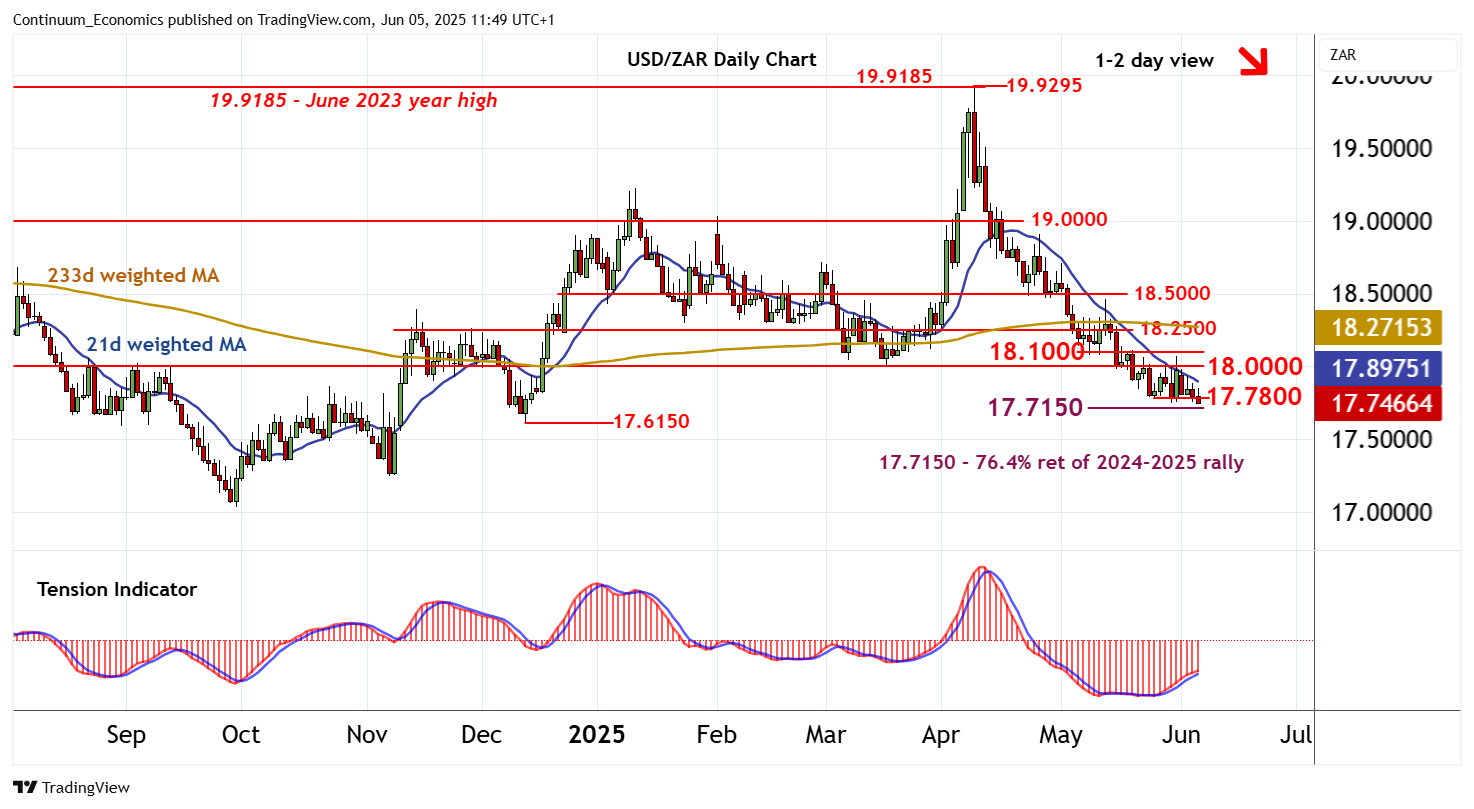
Chart USD/ZAR Update: Fresh 2025 year lows approaching the 17.7150 Fibonacci retracement

Senior Technical Strategist
-
Cautious trade is giving way to a break below the 17.7800 weekly low of 26 May
| Level | Comment | Level | Comment | |||||
|---|---|---|---|---|---|---|---|---|
| R4 | 18.5000 | ** | break level | S1 | 17.7800 | ** | 26 May (w) low | |
| R3 | 18.2500 | * | congestion | S2 | 17.7150 | ** | 76.4% ret of 2024-2025 rally | |
| R2 | 18.1000 | * | break level | S3 | 17.6150 | ** | 12 Dec (m) low | |
| R1 | 18.0000 | ** | congestion | S4 | 17.5000 | * | congestion |
Asterisk denotes strength of level
11:45 BST - Cautious trade is giving way to a break below the 17.7800 weekly low of 26 May, with fresh 2025 year lows currently focusing on the 17.7150 Fibonacci retracementThe flat daily Tension Indicator suggests any initial tests could give way to consolidation. But negative daily stochastics and deteriorating weekly charts highlight room for a later break and extension of April losses towards the 17.6150 monthly low of 12 December. Meanwhile, resistance remains at congestion around 18.0000 and extends to 18.1000. This range should cap any immediate tests higher.