Published: 2025-03-31T12:06:42.000Z
Chart EUR/PLN Update: Consolidating

Senior Technical Strategist
1
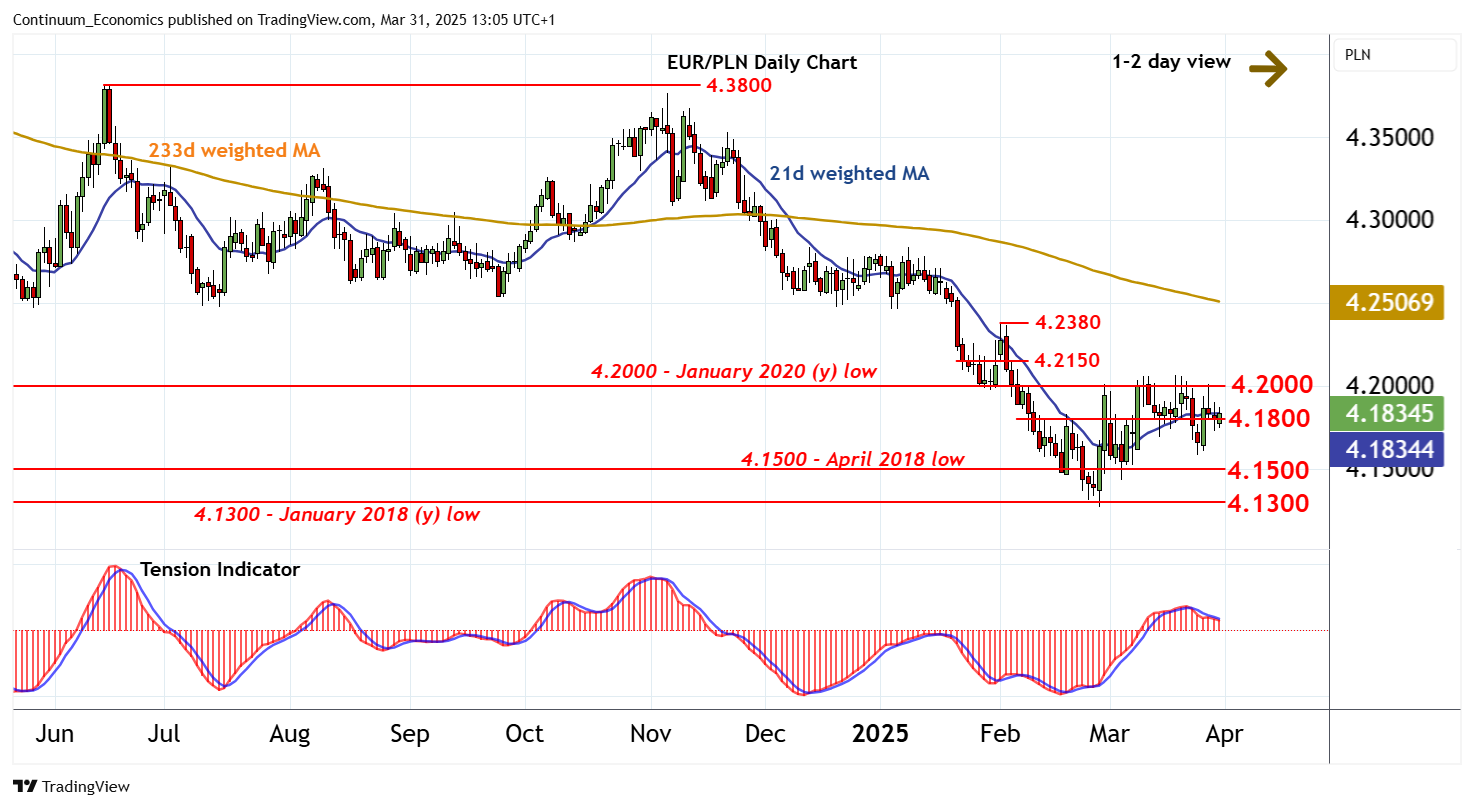
The pullback from resistance at 4.2000 is giving way to consolidation around 4.1800
| Levels | Imp | Comment | Levels | Imp | Comment | |||
| R4 | 4.2380 | ** | 3 Feb (m) high | S1 | 4.1500 | * | April 2018 low, congestion | |
| R3 | 4.2150 | * | break level | S2 | 4.1300 | ** | January 2018 (y) low | |
| R2 | 4.2000 | ** | January 2020 (y) low, figure | S3 | 4.1000 | ** | 76.4% ret of 2010-2022 rally | |
| R1 | 4.1800 | break level | S4 | 4.0130 | ** | May 2015 low |
Asterisk denotes strength of level
12:55 BST - The pullback from resistance at 4.2000 is giving way to consolidation around 4.1800. Mixed intraday studies highlight room for cautious trade around here, before the deteriorating daily Tension Indicator extends losses towards support at 4.1500. Beneath here is the 4.1300 year low of January 2018, but rising weekly charts should limit any break towards here in renewed consolidation. Meanwhile, a close above 4.2000, if seen, would turn sentiment positive and confirm continuation of February gains.