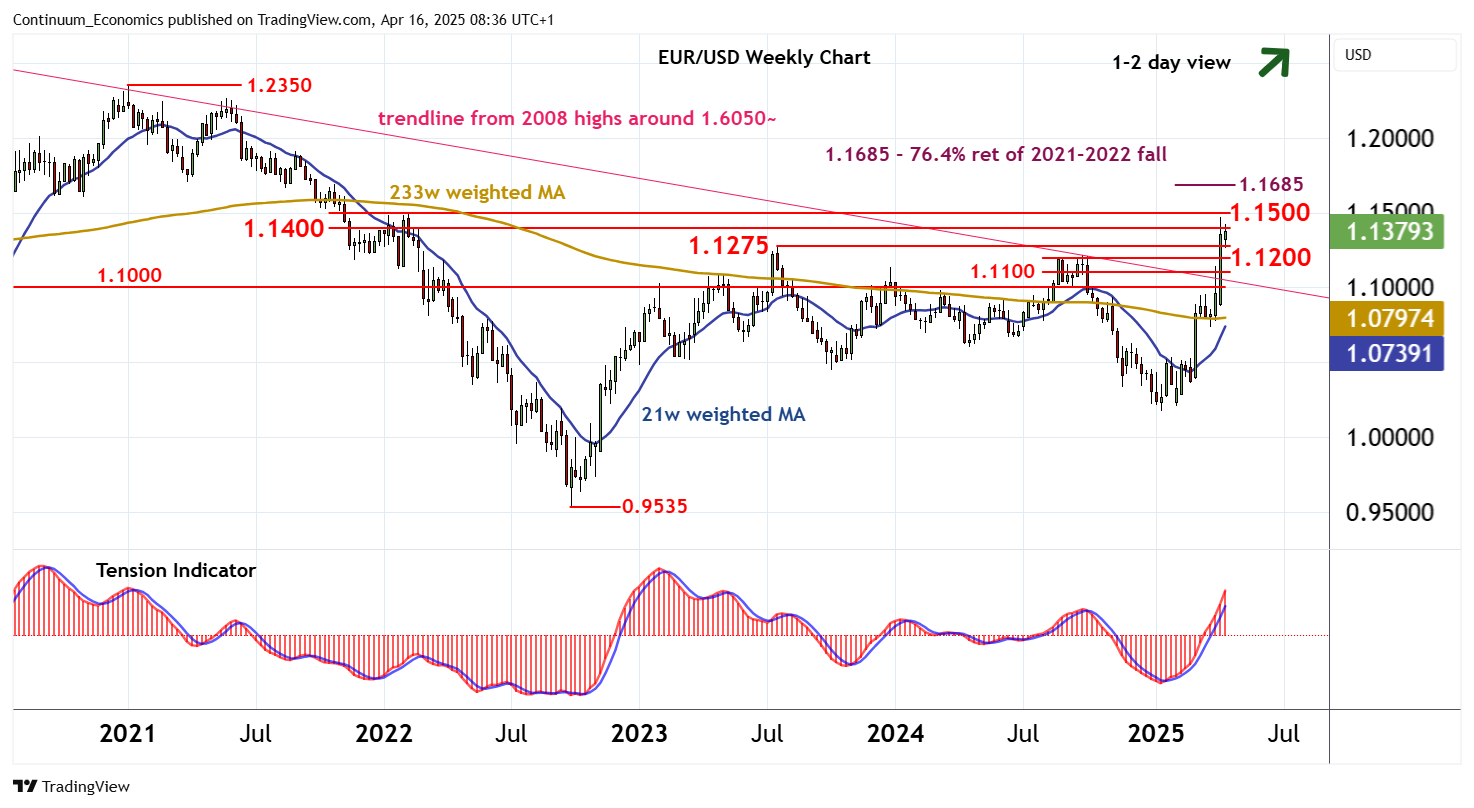
Chart EUR/USD Update: Edging higher

The anticipated minor pullback has bounced from just below support at the 1.1275 year high of July 2023
| Levels | Imp | Comment | Levels | Imp | Comment | |||
|---|---|---|---|---|---|---|---|---|
| R4 | 1.1600 | congestion | S1 | 1.1275 | ** | July 2023 (y) high | ||
| 14 | 1.1500 | ** | break level | S2 | 1.1200 | ** | congestion | |
| R2 | 1.1474 | * | 11 Apr YTD high | S3 | 1.1100 | * | break level | |
| R1 | 1.1400 | * | congestion | S4 | 1.1000 | * | congestion |
Asterisk denotes strength of level
08:30 BST - The anticipated minor pullback has bounced from just below support at the 1.1275 year high of July 2023, as oversold intraday studies unwind, with focus turning back to resistance at congestion around 1.1400. A break above here will put focus on the 1.1474 current year high of 11 April. But mixed daily readings are expected to limit any initial tests in fresh consolidation, before rising weekly charts prompt a later break. A close above 1.1474 will improve sentiment and extend September 2022 gains towards 1.1500. Beyond here is the 1.1685 Fibonacci retracement, where more significant selling interest could appear. Meanwhile, a close below 1.1275 will turn sentiment neutral and give way to consolidation above congestion around 1.1200.