Published: 2025-11-17T09:17:44.000Z
Chart USD Index DXY Update: Consolidating - any gains to remain limited
-
The test of support at congestion around 99.00 has bounced to reach resistance at 99.50
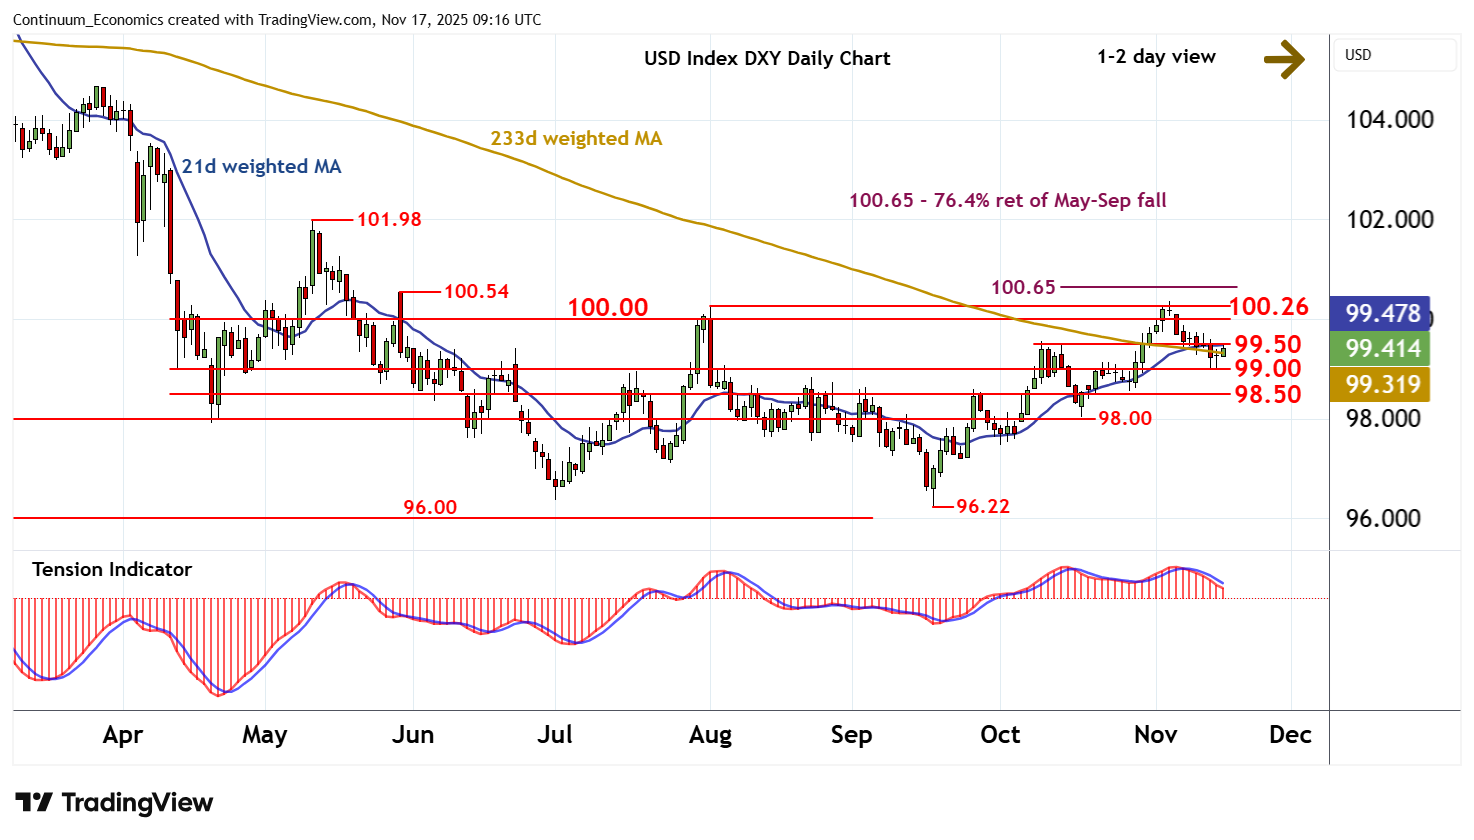
| Levels | Imp | Comment | Levels | Imp | Comment | |||
|---|---|---|---|---|---|---|---|---|
| R4 | 100.54 | ** | 29 May (w) high | S1 | 99.00 | * | congestion | |
| R3 | 100.26 | ** | 1 Aug (m) high | S2 | 98.50 | * | congestion | |
| R2 | 100.00 | ** | congestion | S3 | 98.00 | * | congestion | |
| R1 | 99.50 | * | break level | S4 | 97.50 | * | congestion |
Asterisk denotes strength of level
09:05 GMT - The test of support at congestion around 99.00 has bounced to reach resistance at 99.50. Rising intraday studies and flat oversold daily stochastics highlight potential for a test above here. But the negative daily Tension Indicator and falling overbought weekly stochastics should limit scope in renewed selling interest beneath congestion resistance at 100.00. In the coming sessions, consolidation is looked for. A break below 99.00 will open up further congestion around 98.50, where renewed buying interest/consolidation is expected to appear.