Published: 18/03/25 at 05:24 UTC
Chart USD/INR Update: Under pressure

Technical Analyst
-
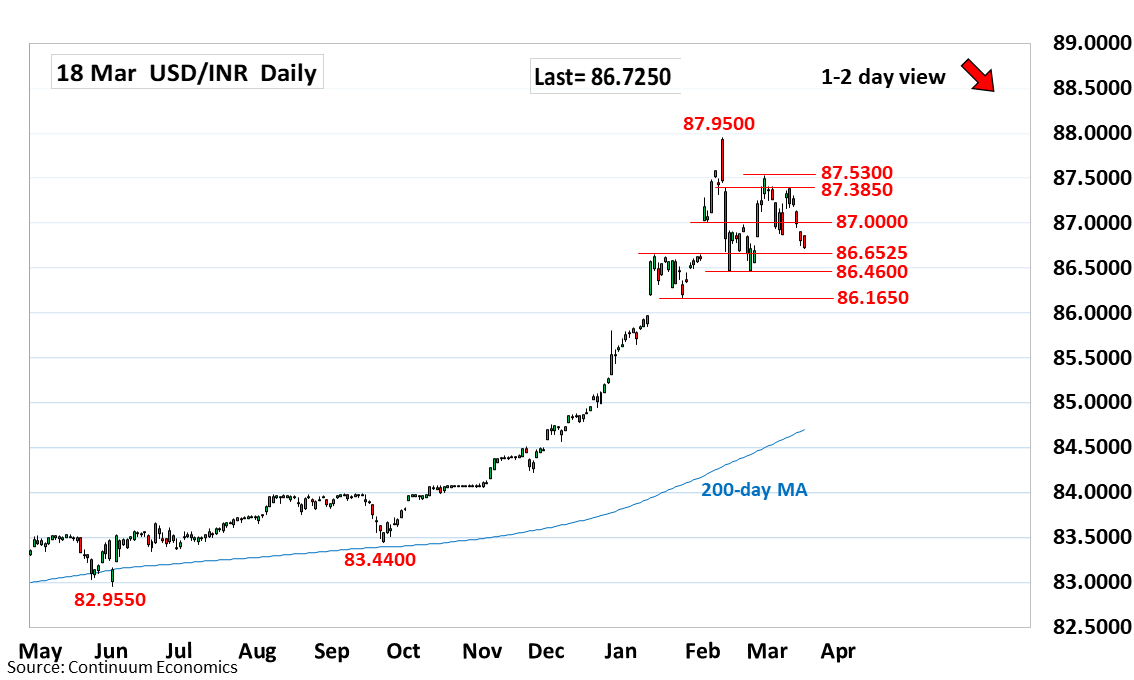
Break of the 87.0000 level and 86.8725 support see prices extending pullback from the 87.5300, 28 February high
| Level | Comment | Level | Comment | |||||
|---|---|---|---|---|---|---|---|---|
| R4 | 87.5825 | * | 6 Feb high | S1 | 86.6525 | * | Jan high | |
| R3 | 87.5300 | ** | 28 Feb high | S2 | 86.4600 | ** | Feb low | |
| R2 | 87.3850 | * | 11 Mar high | S3 | 86.0000 | * | figure | |
| R1 | 87.0000 | * | 4 Feb low | S4 | 85.9700 | * | 10 Jan high, gap |
Asterisk denotes strength of level
05:10 GMT - Break of the 87.0000 level and 86.8725 support see prices extending pullback from the 87.5300, 28 February high. Negative daily and weekly studies suggest room for extension to the 86.6525 support. Below this will shift focus to the critical 86.4600, February low. Break of the latter will confirm a top in place at the 87.9500 all-time high and see deeper pullback to correct strong gains from the September low. Meanwhile, resistance is lowered to the 87.0000 level which is expected to cap and sustain losses from the 87.3850/87.5300 highs.