Chart AUD/USD Update: Balanced at highs
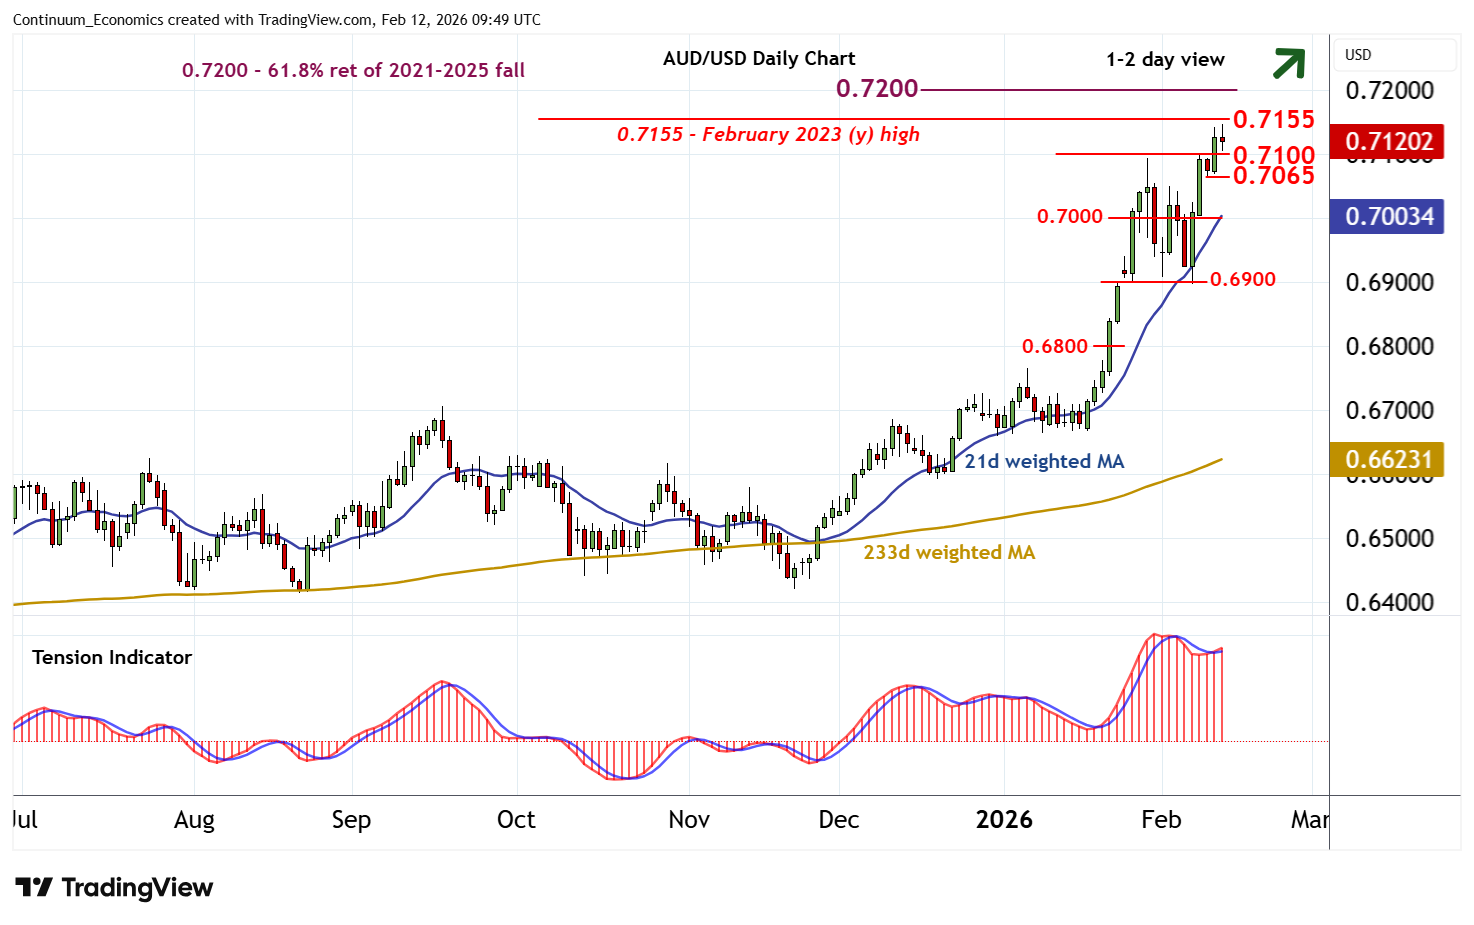
Prices have posted a fresh 2026 year high around 0.7145
| Levels | Imp | Comment | Levels | Imp | Comment | |||
|---|---|---|---|---|---|---|---|---|
| R4 | 0.7300 | ** | congestion | S1 | 0.7100 | break level | ||
| R3 | 0.7280~ | ** | June 2022 high | S2 | 0.7065 | * | 10-11 Feb lows | |
| R2 | 0.7200 | ** | 61.8% ret of 2021-2025 fall | S3 | 0.7000 | * | congestion | |
| R1 | 0.7155~ | ** | February 2023 (y) high | S4 | 0.6900 | ** | break level |
Asterisk denotes strength of level
09:30 GMT - Prices have posted a fresh 2026 year high around 0.7145, before settling lower into consolidation above 0.7100. Intraday studies are under pressure and rising daily stochastics are flattening, suggesting potential for a test beneath here. But the positive daily Tension Indicator and positive weekly charts should limit scope in renewed buying interest above the 0.7065 lows from 10-11 February. A close beneath here, if seen, will add weight to sentiment and prompt a deeper correction towards congestion around 0.7000. Following cautious trade, fresh gains are looked for. But a break above the 0.7155~ year high of February 2023 is needed to turn sentiment positive and open up strong resistance at the 0.7200 Fibonacci retracement.