Published: 2026-02-04T00:31:19.000Z
Chart AUD/USD Update: Higher in consolidation
-
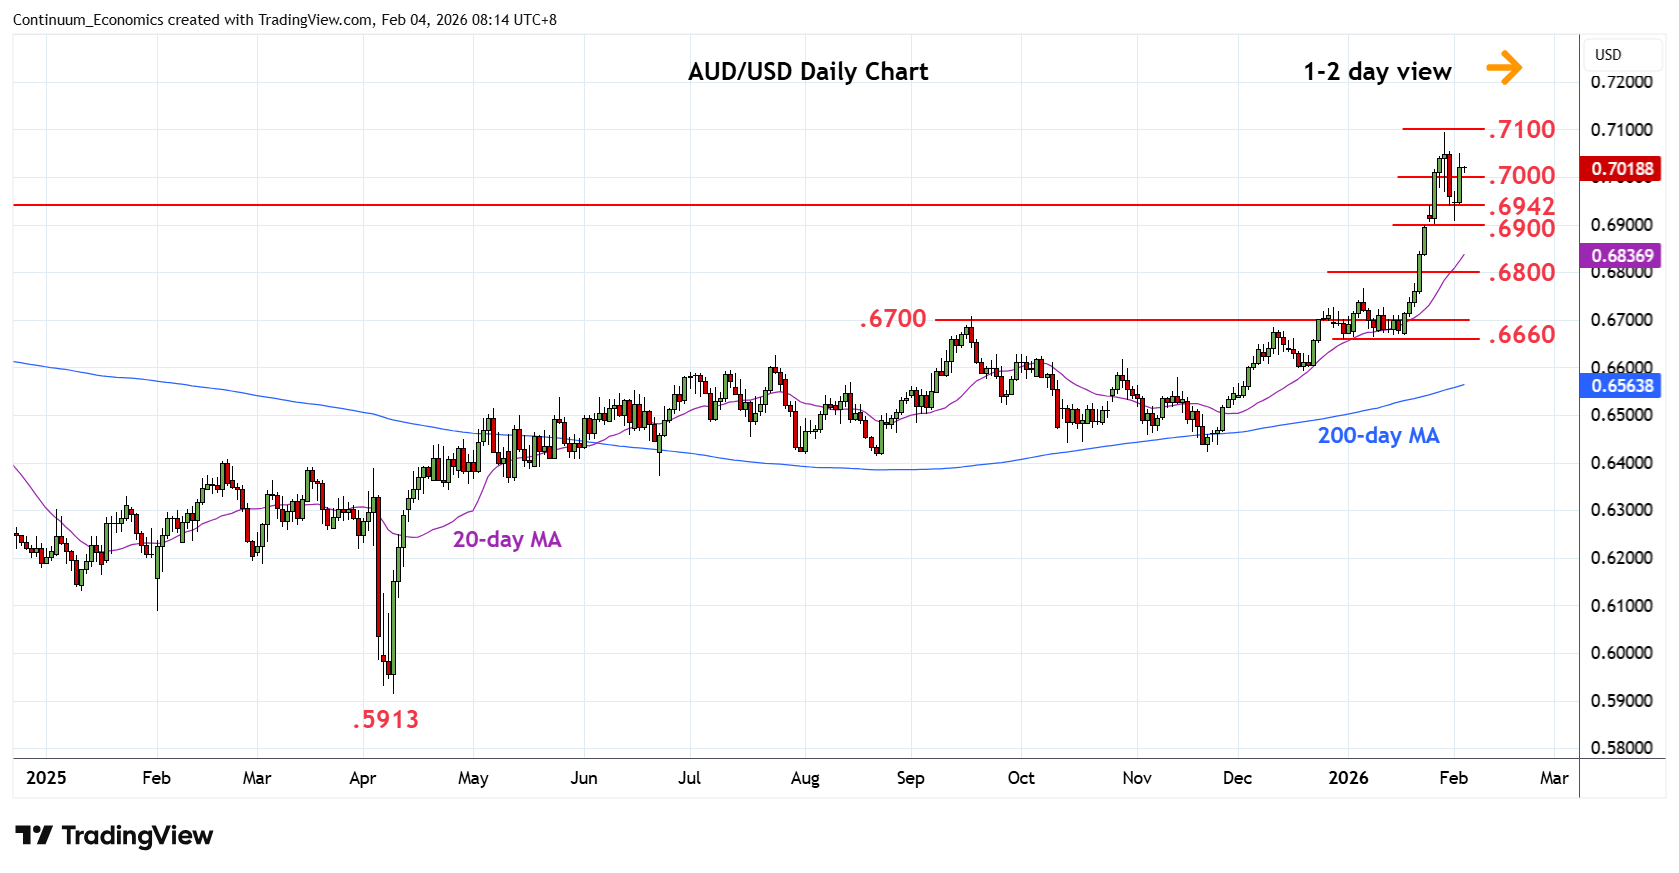
Bounce from the above the .6900 support to regain the .7000 level has seen gains to resistance at the .7050 congestion
| Levels | Imp | Comment | Levels | Imp | Comment | |||
|---|---|---|---|---|---|---|---|---|
| R4 | 0.7210 | * | 61.8% 2021/2025 fall | S1 | 0.6942 | * | 2024 year high | |
| R3 | 0.7158 | ** | Feb 2023 year high | S2 | 0.6900 | ** | 23 Jan high, gap | |
| R2 | 0.7094 | ** | 29 Jan YTD high | S3 | 0.6850 | * | congestion | |
| R1 | 0.7050 | * | congestion | S4 | 0.6800 | * | congestion |
Asterisk denotes strength of level
00:20 GMT - Bounce from the above the .6900 support to regain the .7000 level has seen gains to resistance at the .7050 congestion. Would take break here to expose the .7094 high to retest but mixed daily studies suggest this likely to cap for now and extend consolidation below this. Break, if seen, will resume the April gains and see room for extension to strong resistance at .7158/.7210, 2023 year high and 61.8% Fibonacci level. Meanwhile, support starts at .6942 and extend to the .6900 congestion, expected to underpin.