Published: 2026-01-07T08:30:18.000Z
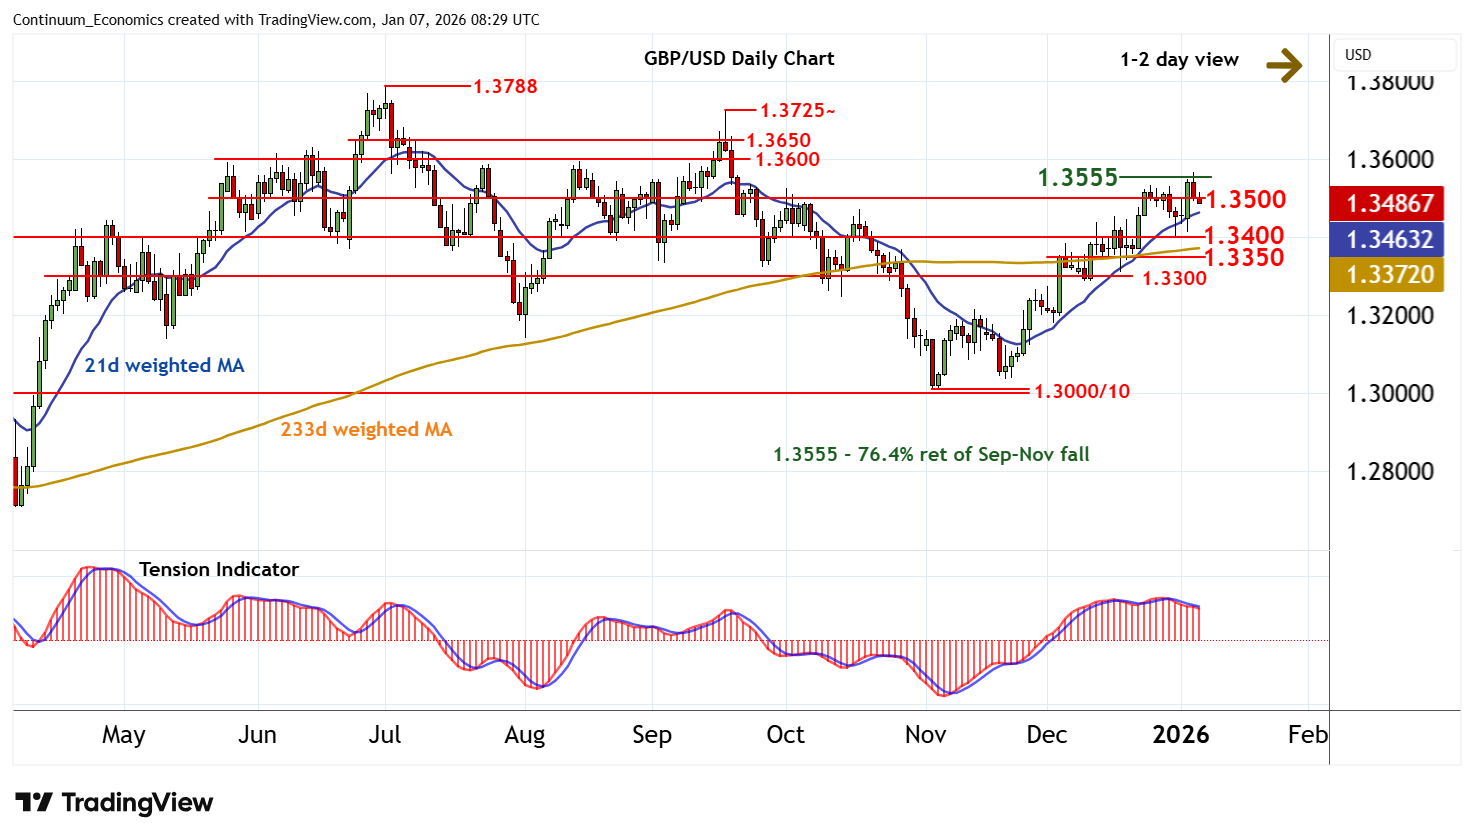
Chart GBP/USD Update: Pullback from 1.3555 Fibonacci retracement
2
The anticipated break above resistance at the 1.3555 Fibonacci retracement has not been seen
| Level | Comment | Level | Comment | |||||
|---|---|---|---|---|---|---|---|---|
| R4 | 1.3650 | congestion | S1 | 1.3400 | * | congestion | ||
| R3 | 1.3600 | * | congestion | S2 | 1.3350 | * | congestion lows | |
| R2 | 1.3555 | ** | 76.4% ret of Sep-Nov fall | S3 | 1.3300 | * | congestion | |
| R1 | 1.3500 | * | congestion | S4 | 1.3200 | ** | break level |
Asterisk denotes strength of level
08:10 GMT - The anticipated break above resistance at the 1.3555 Fibonacci retracement has not been seen, as intraday studies turn down and prompt a break below 1.3500. Daily readings have turned mixed/negative, highlighting room for continuation towards congestion support at 1.3400. But rising weekly charts are expected to limit any tests in fresh consolidation. Meanwhile, resistance is lowered to congestion around 1.3500. But a close above 1.3555 is needed to turn sentiment positive and extend November gains initially towards congestion around 1.3600.