Chart GBP/USD Update: Further gains to remain limited

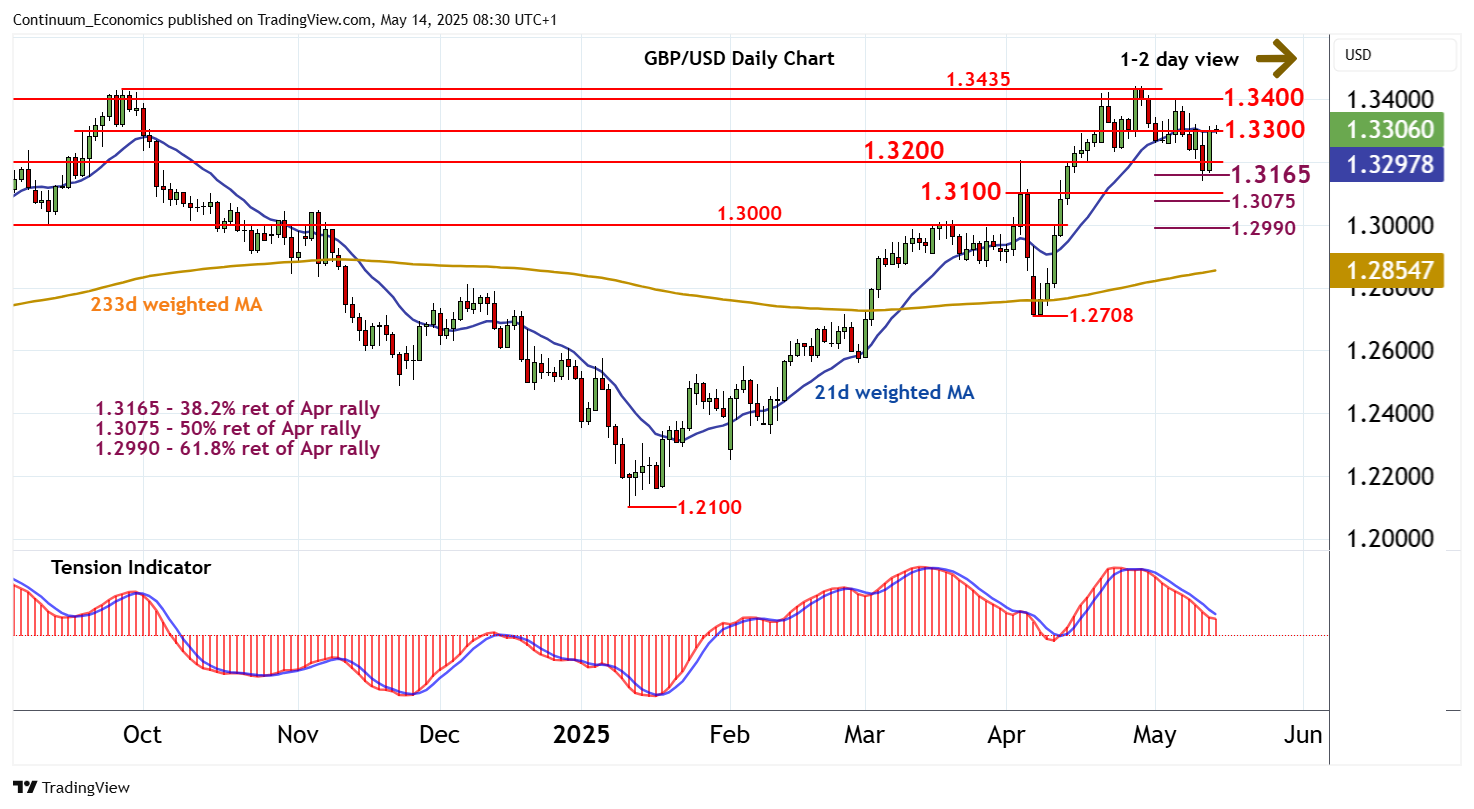
Consolidation following the test of support at the 1.3165 Fibonacci retracement has given way to a steady bounce
| Level | Comment | Level | Comment | |||||
|---|---|---|---|---|---|---|---|---|
| R4 | 1.3500 | ** | congestion | S1 | 1.3200 | ** | break level | |
| R3 | 1.3435 | ** | 26 Sep 2024 (y) high | S2 | 1.3165 | ** | 38.2% ret of Apr rally | |
| R2 | 1.3400 | congestion | S3 | 1.3100 | * | break level | ||
| R1 | 1.3300 | break level | S4 | 1.3075 | ** | 50% ret of Apr rally |
Asterisk denotes strength of level
08:10 BST - Consolidation following the test of support at the 1.3165 Fibonacci retracement has given way to a steady bounce to resistance at 1.3300, where unwinding overbought intraday studies are prompting fresh reactions. Oversold daily stochastics are edging higher, suggesting potential for a test above here. But the negative daily Tension Indicator and deteriorating weekly charts are expected to limit scope in renewed selling interest beneath congestion around 1.3400. In the coming sessions, cautious is highlighted, before prices turn lower once again. Support is at 1.3200. But a close below 1.3165 is needed to turn sentiment negative and extend late-April losses towards 1.3100.