Published: 2026-02-13T14:48:13.000Z
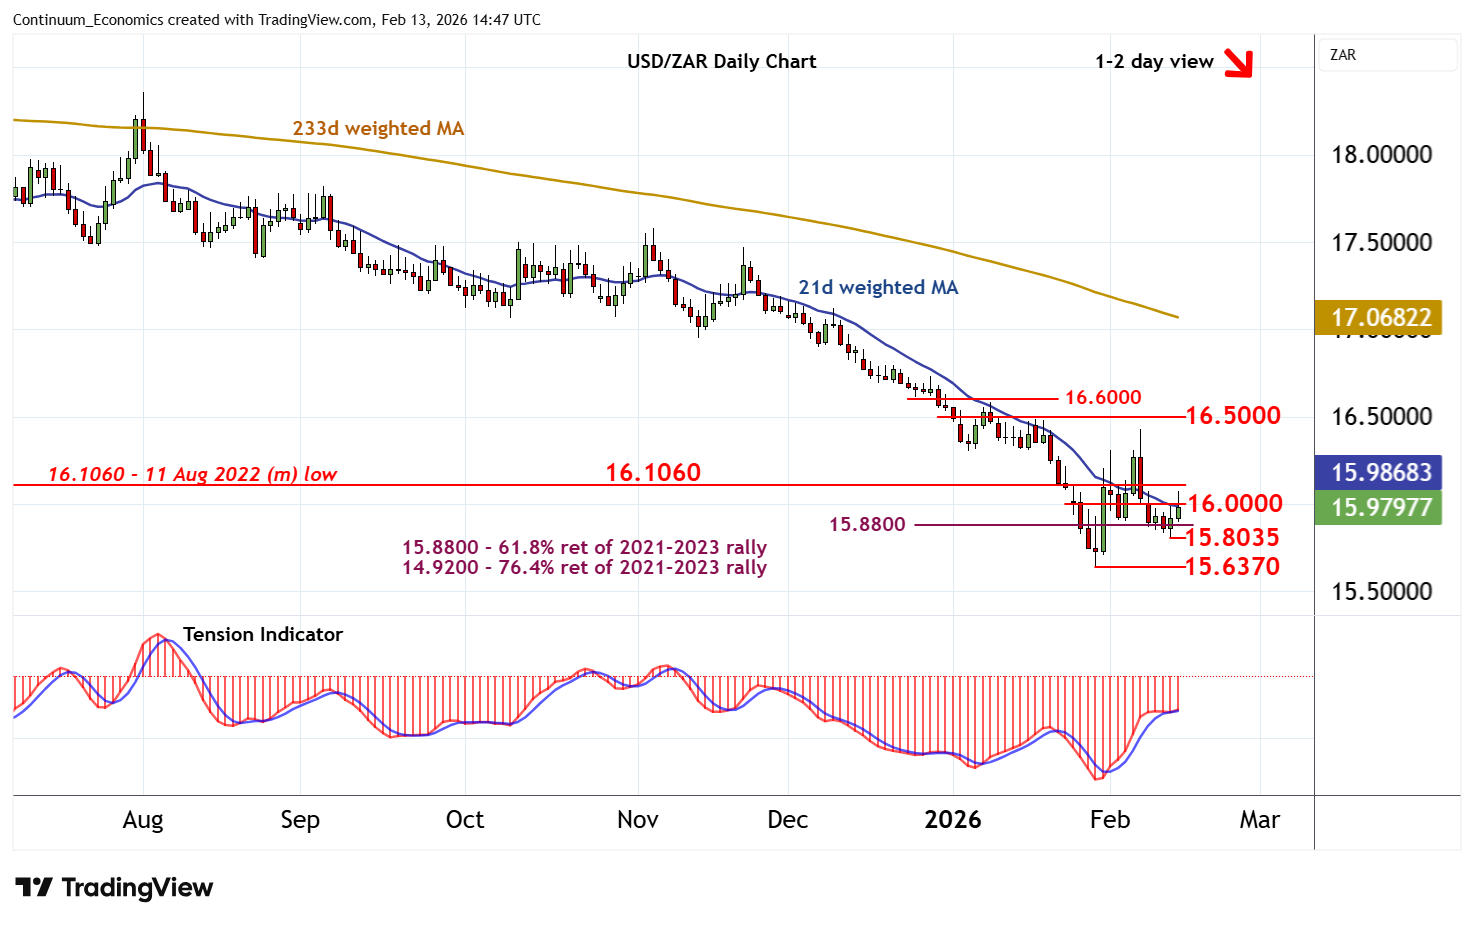
Chart USD/ZAR Update: Limited tests higher
7
Still little change
| Level | Comment | Level | Comment | |||||
|---|---|---|---|---|---|---|---|---|
| R4 | 16.7000 | break level | S1 | 15.8035 | 12 Feb low | |||
| R3 | 16.5000 | break level | S2 | 15.6370 | ** | 29 Jan YTD low | ||
| R2 | 16.1060 | ** | 11 Aug 2022 (m) low | S3 | 15.1665 | * | June 2022 low | |
| R1 | 16.0000 | ** | congestion | S4 | 15.0000 | ** | congestion |
Asterisk denotes strength of level
14:20 GMT - Still little change, as prices extend cautious trade beneath congestion resistance at 16.0000. Daily readings have ticked higher, suggesting room for a test above here towards 16.1060. But negative weekly readings and bearish longer-term charts should limit any further tests beyond here in consolidation beneath 16.5000. Following cautious/corrective trade, fresh losses are looked for. Support is at the 15.8035 low of 12 February. But a close below critical support at the 15.6370 current year low of 29 January will add weight to sentiment and extend June 2023 losses initially towards the 15.1665 low of June 2022.