Chart USD/ZAR Update: Leaning lower in range
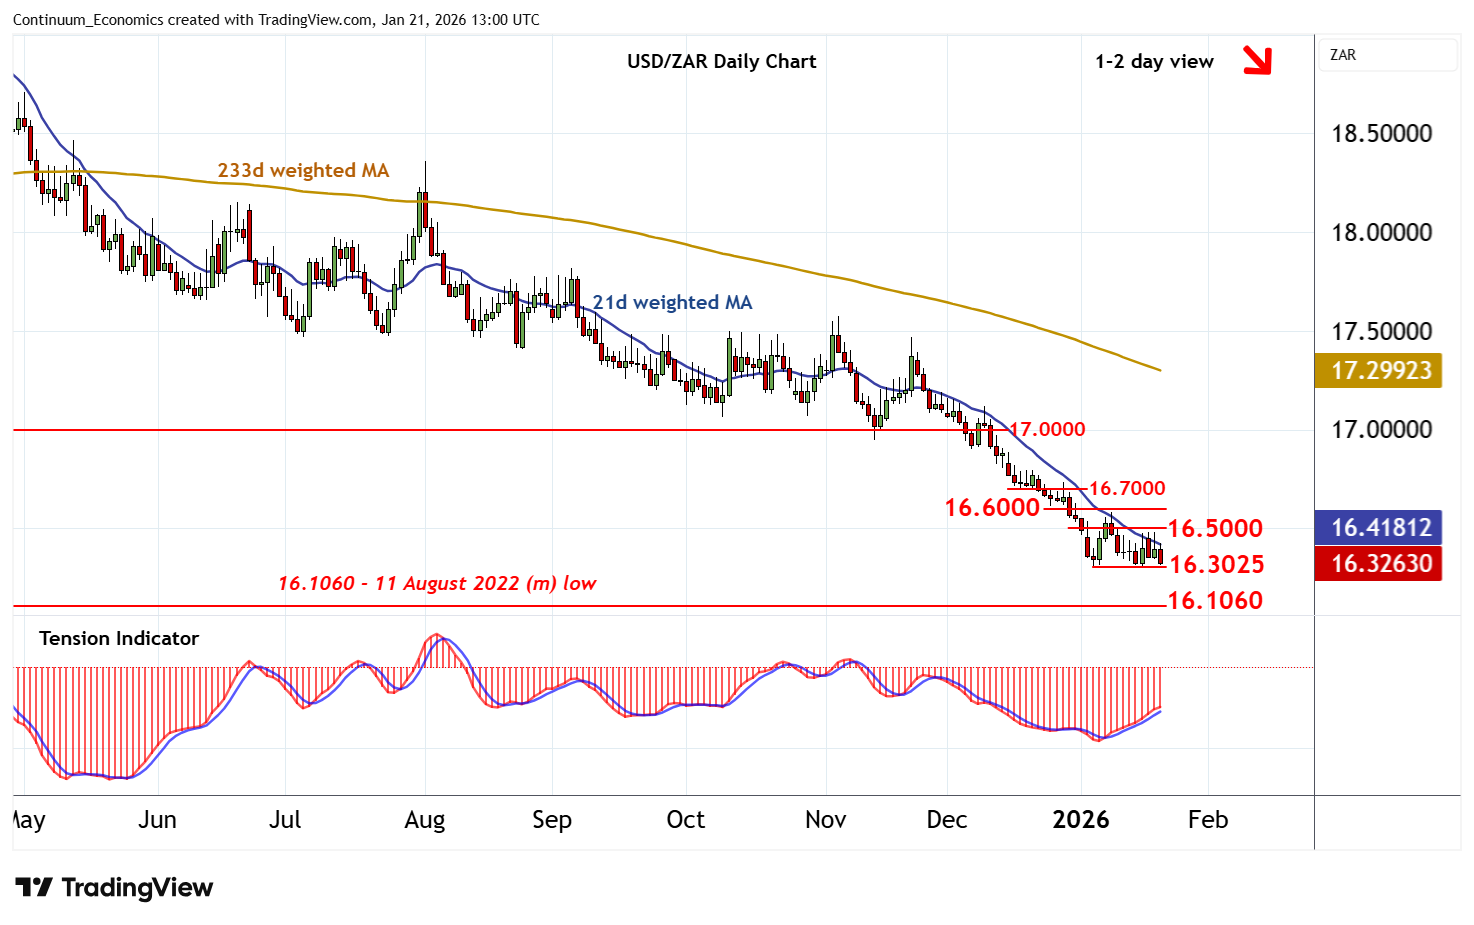
Little change, as prices extend cautious/choppy trade, centred around 16.4000
| Level | Comment | Level | Comment | |||||
|---|---|---|---|---|---|---|---|---|
| R4 | 16.8000 | break level | S1 | 16.3025 | * | 6 Jan YTD low | ||
| R3 | 16.7000 | break level | S2 | 16.1060 | ** | 11 Aug 2022 (m) low | ||
| R2 | 16.6000 | break level | S3 | 16.0000 | ** | congestion | ||
| R1 | 16.5000 | break level | S4 | 15.8800 | ** | 61.8% ret of 2021-2023 rally |
Asterisk denotes strength of level
12:45 GMT - Little change, as prices extend cautious/choppy trade, centred around 16.4000. Intraday studies are under pressure and overbought daily stochastics are unwinding, highlighting room for a test of strong support at the 16.3025 current year low of 6 January. The rising daily Tension Indicator suggests any immediate tests could give way to consolidation, before negative weekly charts prompt a break and extend the April bear trend towards the 16.1060 monthly low of 11 August 2022 and historic congestion around 16.0000. Just lower is the 15.8800 Fibonacci retracement. But flat oversold weekly stochastics are expected to limit any initial tests of this broad 15.8800 - 16.1060 range in short-covering/consolidation. Meanwhile, resistance remains at 16.5000. A close above here, if seen, will help to stabilise price action and prompt consolidation beneath 16.6000.