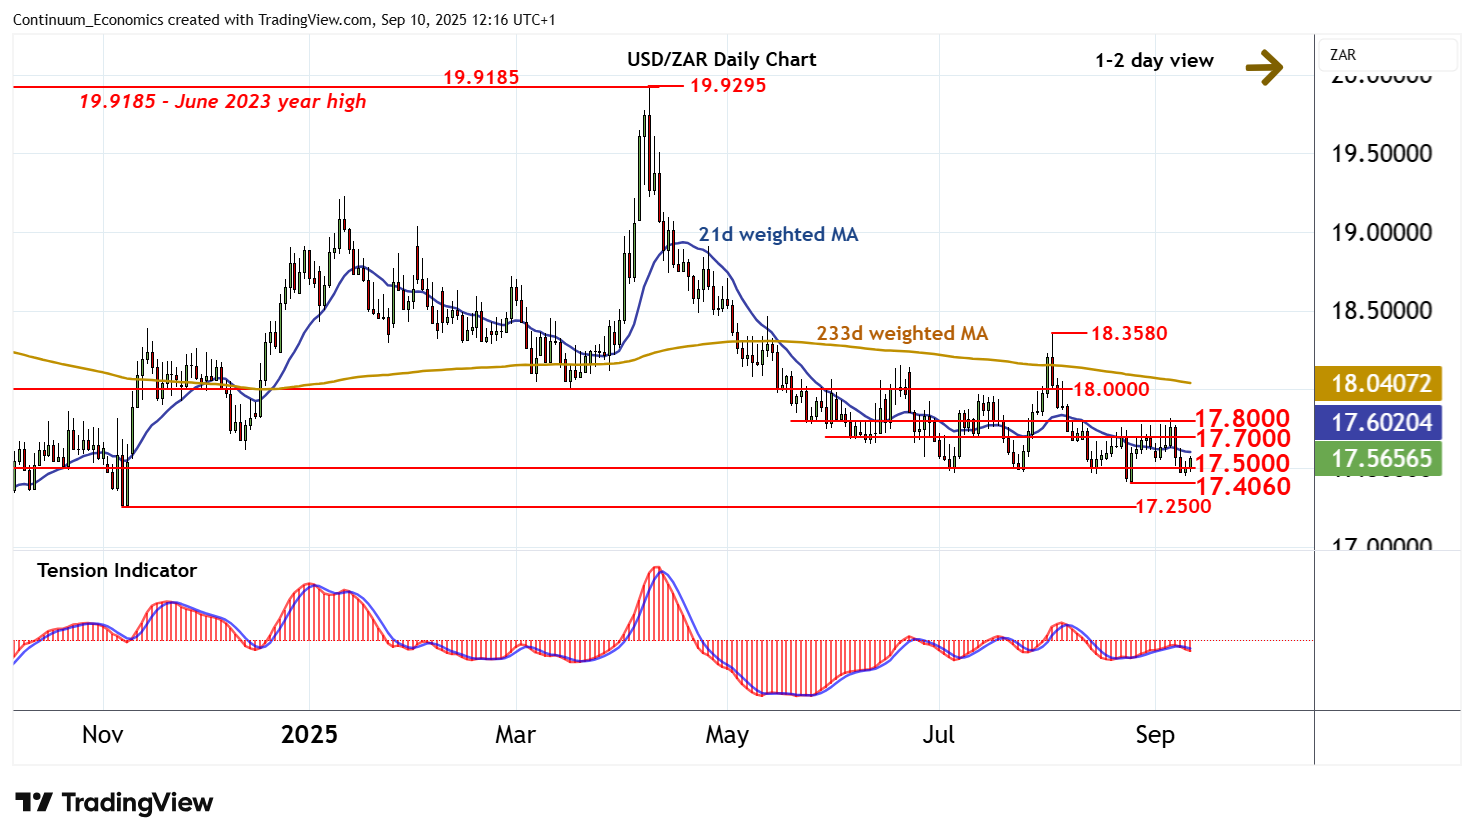
Chart USD/ZAR Update: Back in range
Consolidation above critical support at the 17.4060 current year low of 25 August has given way to a break back above 17.5000
| Level | Comment | Level | Comment | |||||
|---|---|---|---|---|---|---|---|---|
| R4 | 18.3580 | ** | 1 Aug (w) high | S1 | 17.5000 | ** | congestion | |
| R3 | 18.0000 | ** | congestion | S2 | 17.4060 | ** | 25 Aug YTD low | |
| R2 | 17.8000 | * | congestion | S3 | 17.2500 | ** | 7 Nov (m) low | |
| R1 | 17.7000 | * | congestion | S4 | 17.0315 | ** | 30 Sep 2024 (y) low |
Asterisk denotes strength of level
12:00 BST - Consolidation above critical support at the 17.4060 current year low of 25 August has given way to a break back above 17.5000, with prices currently trading around 17.5700. Intraday studies are rising, pointing to room for further strength. But negative daily readings and mixed weekly charts are expected to limit scope in renewed consolidation beneath congestion resistance at 17.7000. Meanwhile, support remains down to 17.4060. A close beneath here would add weight to sentiment and extend April losses towards critical multi-month support at the 17.0315 year low of 30 September 2024.