Published: 2025-12-17T13:01:37.000Z
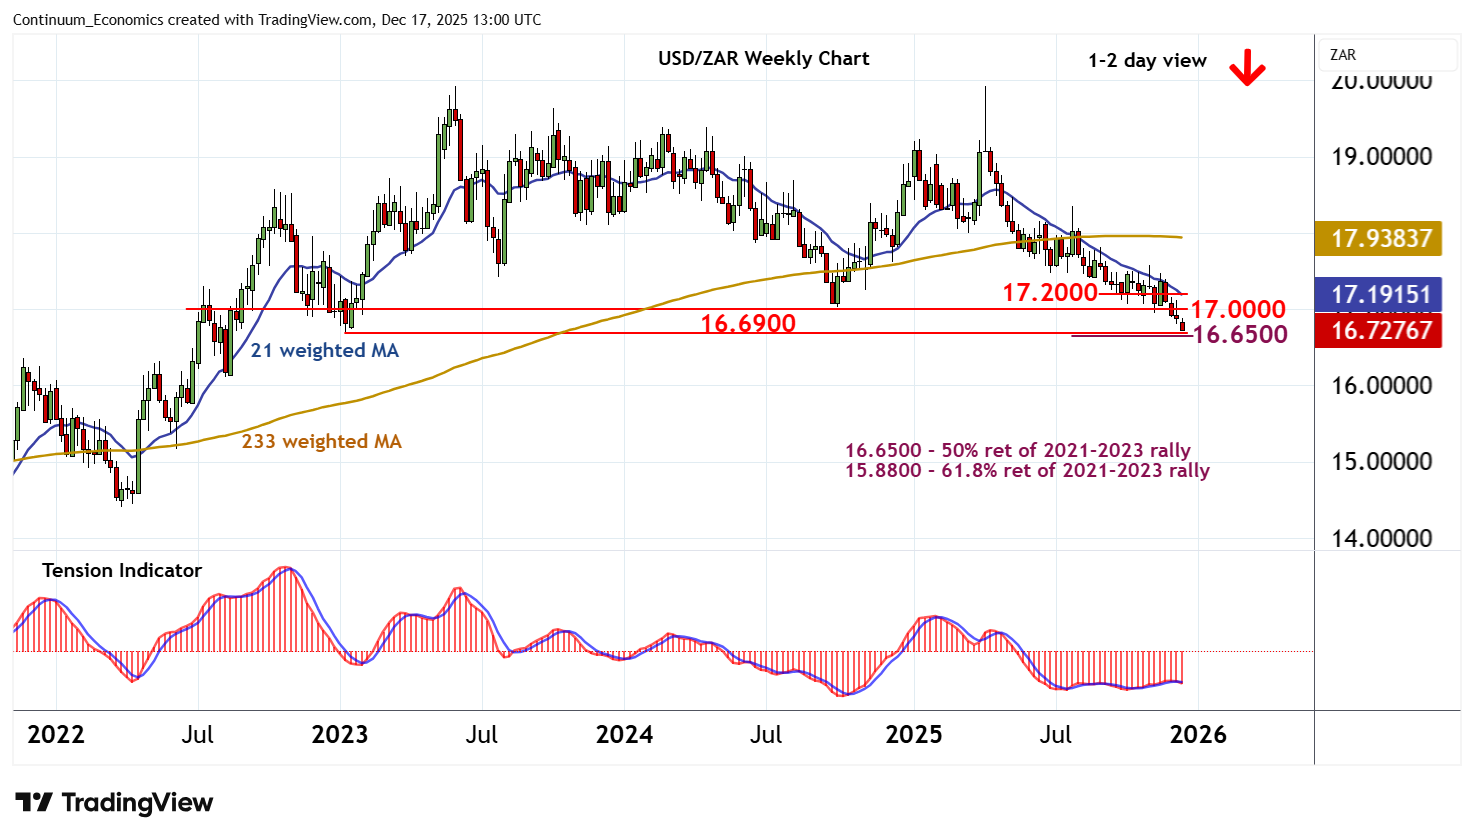
Chart USD/ZAR Update: April losses approaching critical support at 16.6500 - 16.6900
2
Yet another fresh year low
| Level | Comment | Level | Comment | |||||
|---|---|---|---|---|---|---|---|---|
| R4 | 17.5000 | ** | congestion | S1 | 16.7100 | fresh 2025 (y) low | ||
| R3 | 17.4000 | * | congestion | S2 | 16.6900 | ** | January 2023 (y) low | |
| R2 | 17.2000 | * | congestion | S3 | 16.6500 | ** | 50% ret of 2021-2023 rally | |
| R1 | 17.0000 | ** | congestion | S4 | 16.1060 | ** | August 2022 low |
Asterisk denotes strength of level
12:40 GMT - Yet another fresh year low, with prices currently trading around 16.7350. Daily studies are negative and broader weekly charts are also under pressure, highlighting room for further losses in the coming sessions. A break beneath the 16.7100 year low will add weight to sentiment and extend April losses towards the 16.6900 year low of January 2023 and the 16.6500 Fibonacci retracement. However, already oversold daily stochastics could limit any initial tests of this range in short-covering/consolidation. Meanwhile, resistance remains at congestion around 17.0000 and extends to further congestion at 17.2000. This range should cap any immediate tests higher.