Chart USD/JPY Update: Under pressure in both USD- and JPY-driven trade
Consolidation beneath congestion resistance at 156.00 has given way to anticipated losses in both USD- and JPY-driven trade
| Levels | Imp | Comment | Levels | Imp | Comment | |||
|---|---|---|---|---|---|---|---|---|
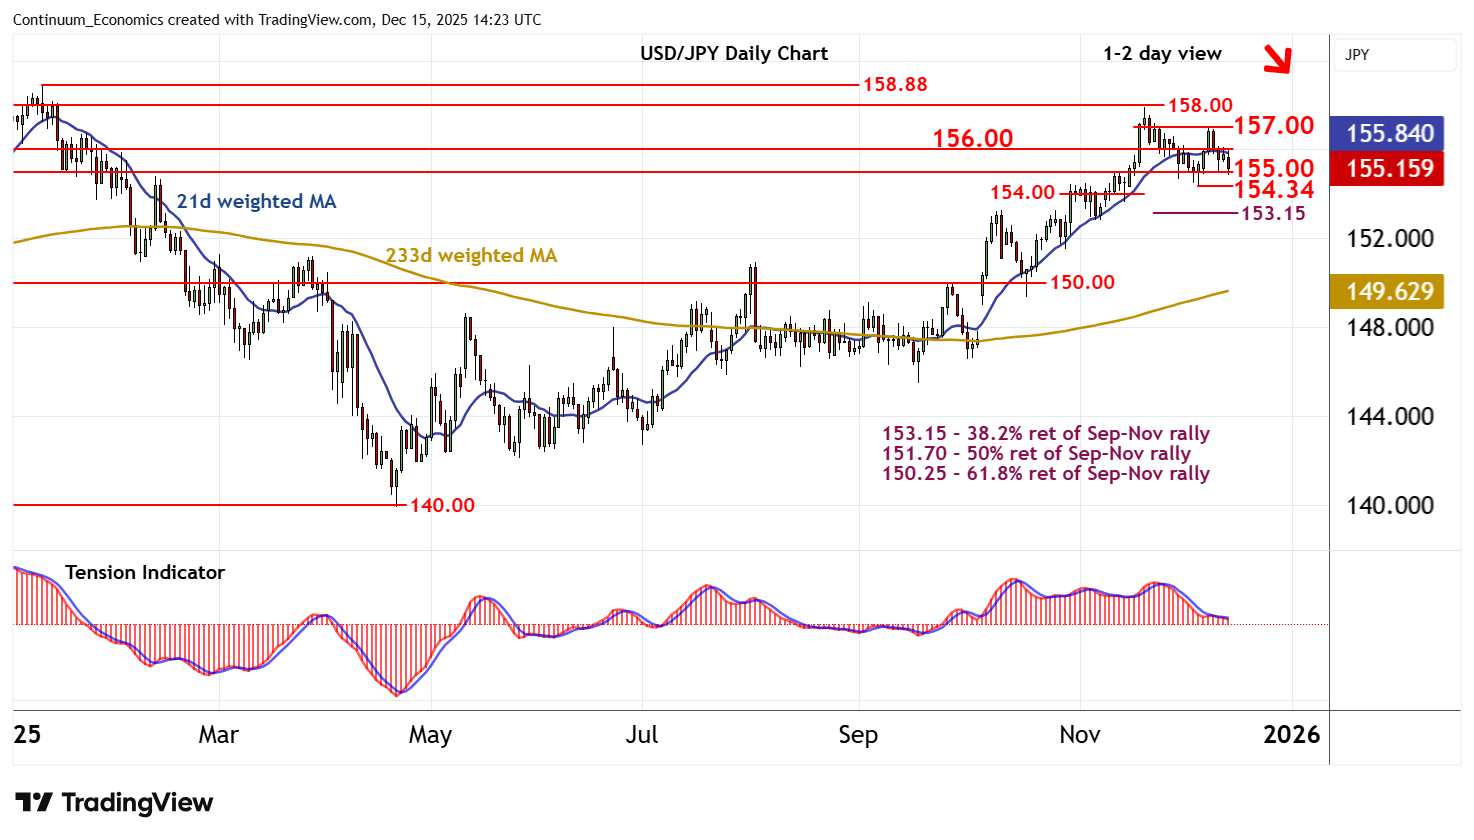
| R4 | 158.88 | ** | 10 Jan YTD high | S1 | 155.00 | * | break level | |
| R3 | 157.90/00 | * | 20 Nov (m) high; break level | S2 | 154.34 | * | 5 Dec (w) low | |
| R2 | 157.00 | minor congestion | S3 | 154.00 | * | break level | ||
| R1 | 156.00 | * | congestion | S4 | 153.15 | ** | 38.2% ret of Sep-Nov rally |
Asterisk denotes strength of level
14:05 GMT - Consolidation beneath congestion resistance at 156.00 has given way to anticipated losses in both USD- and JPY-driven trade, with prices currently balanced above support at the 155.00 break level. Daily readings are negative and broader weekly charts are deteriorating, highlighting room for further losses in the coming sessions. A break below 155.00 will add weight to sentiment and open up the 154.34 weekly low of 5 December. A further close beneath here will confirm continuation of late-November losses, as 154.00 then attracts, ahead of the 153.15 Fibonacci retracement. Meanwhile, a close above 156.00, if seen, will help to stabilise price action and prompt consolidation beneath further congestion around 157.00.