Published: 2025-11-24T13:13:44.000Z
Chart USD/ZAR Update: Consolidating gains - studies rising
-
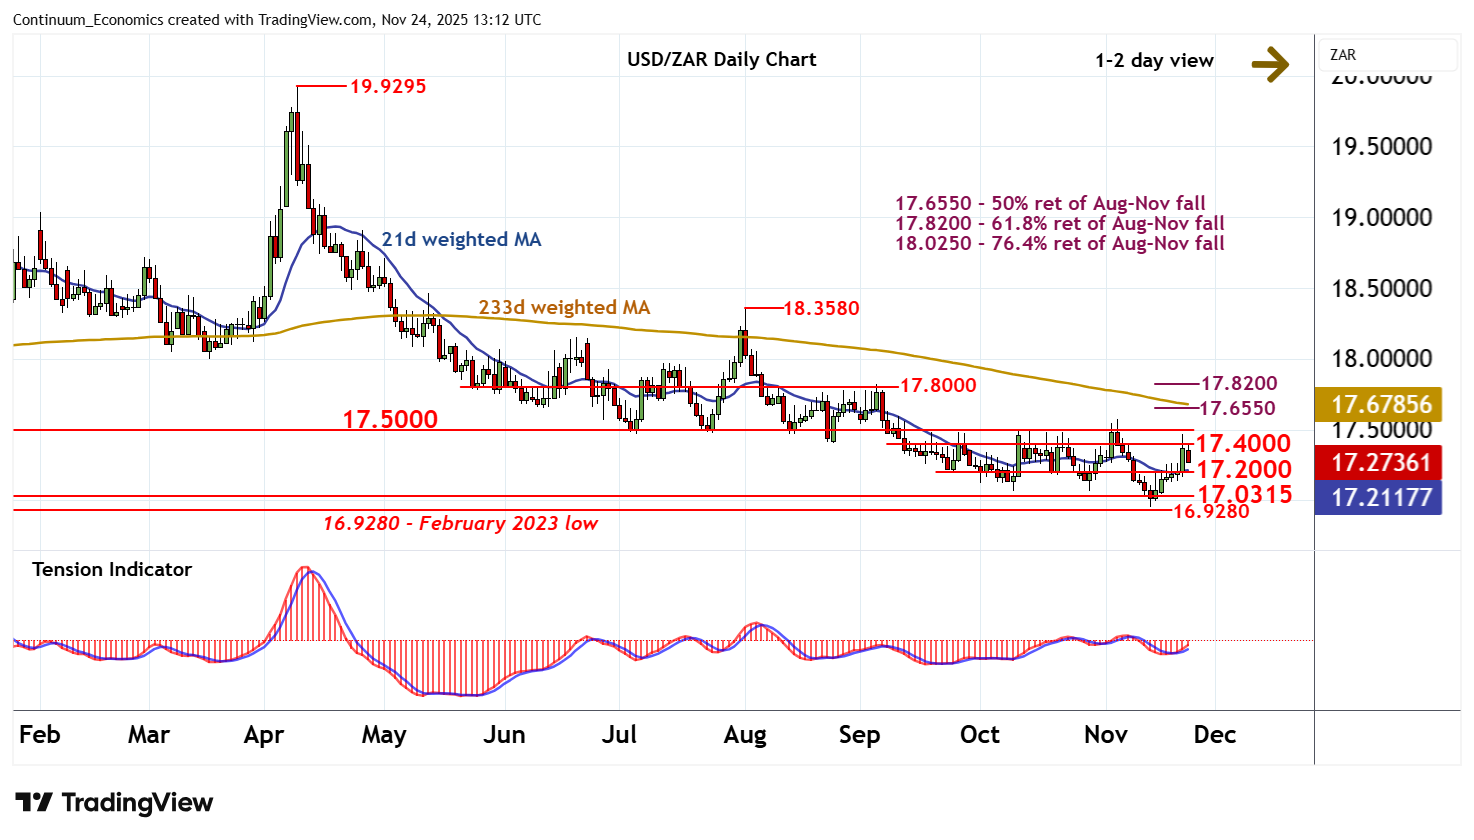
The test of congestion resistance within 17.4000 - 17.5000 has given way to a pullback
| Level | Comment | Level | Comment | |||||
|---|---|---|---|---|---|---|---|---|
| R4 | 17.6550 | ** | 50% ret of Aug-Oct fall | S1 | 17.2000 | * | congestion | |
| R3 | 17.5775 | 5 Nov (w) high | S2 | 17.0315 | ** | 30 Sep 2024 (y) low | ||
| R2 | 17.5000 | ** | congestion | S3 | 17.0000 | ** | congestion | |
| R1 | 17.4000 | * | congestion | S4 | 16.9495 | ** | 13 Nov YTD low |
Asterisk denotes strength of level
12:55 GMT - The test of congestion resistance within 17.4000 - 17.5000 has given way to a pullback, as overbought intraday studies unwind, with steady selling interest pushing prices to 17.2700~. Daily readings continue to rise, however, and broader weekly charts are positive, suggesting any deeper losses could give way to consolidation above congestion support at 17.2000. Following cautious trade, fresh gains are looked for. A close above 17.5000 is needed to improve sentiment and extend mid-November gains beyond the 17.5775 weekly high of 5 November towards the 17.6550 Fibonacci retracement.