Continuum Economics
  • Search
  • About Us
  • Buy
  • Invite A Friend
  • My Basket
  • Articles
  • Calendar
  • Forecasts
  • Events
  • Data
  • Newsletters
  • My Alerts
  • Community
  • Directory
  • About Us
  • Buy
  • Invite A Friend
  • My Basket
  • Articles
    • All
    • Thematic
    • Tactical
    • Asia
    • EMEA
    • Americas
    • Newsletters
    • Freemium
    • Editor's Choice
    • Most Viewed
    • Most Shared
    • Most Liked
  • Calendar
    • Interactive
      • China
      • United States
      • Eurozone
      • United Kingdom
    • Month Ahead
    • Reviews
    • Previews
  • Forecasts
    • Forecasts
    • Key Views
  • Events
    • Media
    • Conference Calls
  • Data
    • Country Insights
    • Shadow Credit Ratings
    • Full CI Data Download
  • Newsletters
  • My Alerts
  • Community
    • FX
    • Fixed Income
    • Macro Strategy
    • Credit Markets
    • Equities
    • Commodities
    • Precious Metals
    • Renewables
  • Directory
  • My Account
  • Notifications Setup
  • Administration Panel
  • Account Details
  • Recent Devices
  • Distribution Lists
  • Shared Free Trials
  • Saved Articles
  • Shared Alerts
  • My Posts
Back
Published: 2026-01-30T00:33:06.000Z

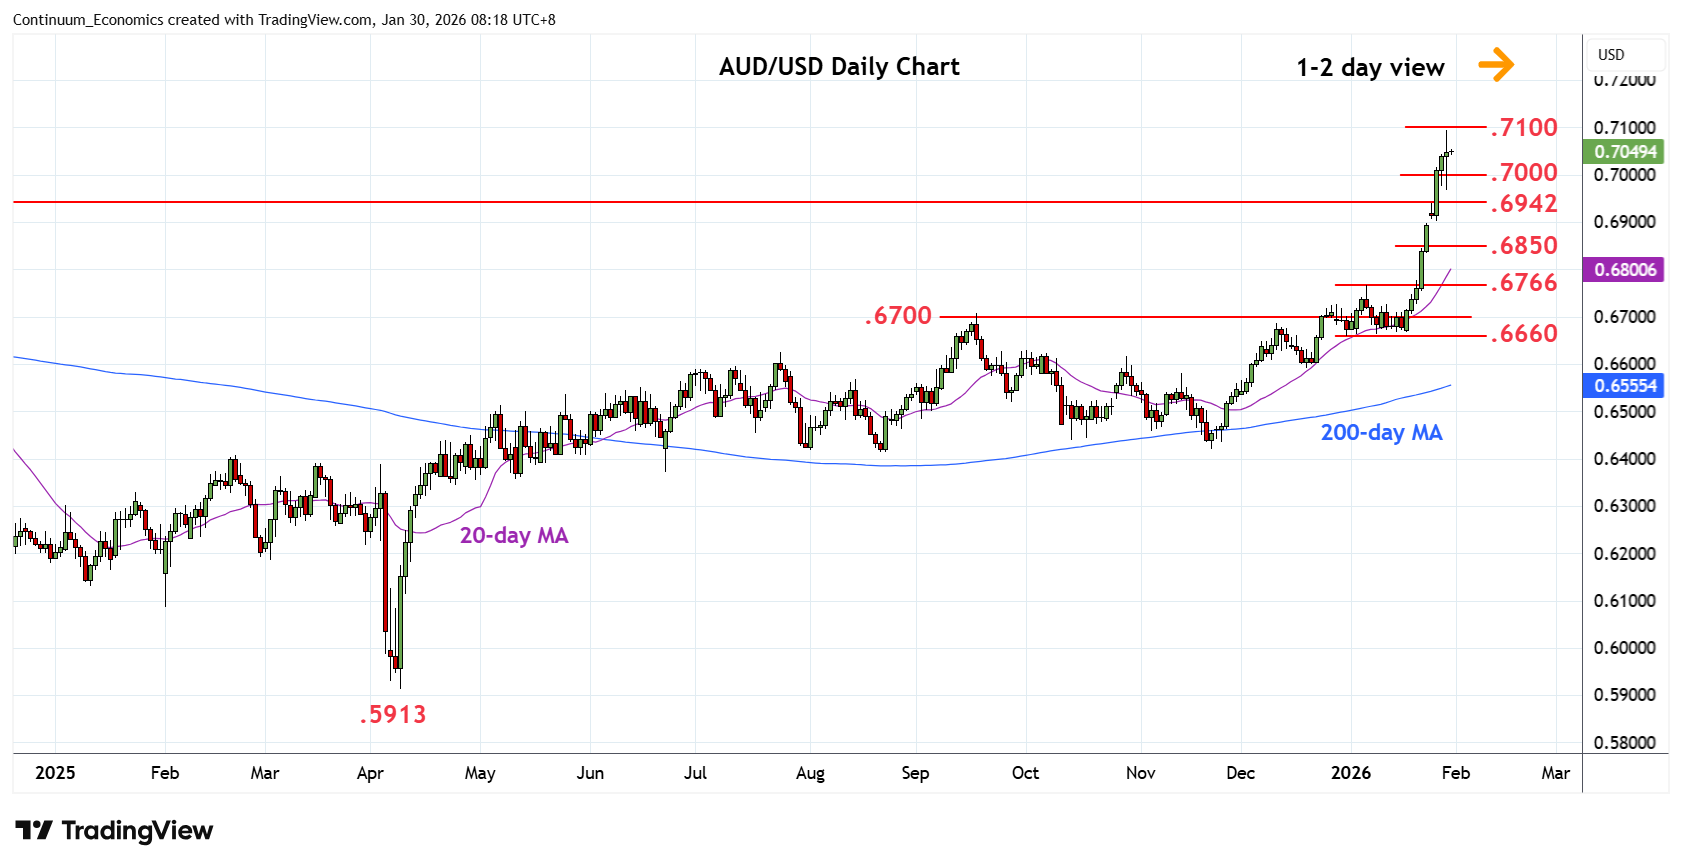
Chart AUD/USD Update: Consolidating beneath .7100 level

1

Settled back in consolidation just beneath the .7100 level as prices unwind overbought intraday studies

 LevelsImpComment  LevelsImpComment
R40.7205*50% 2021/2025 fall S10.7000*figure
R30.7158**Feb 2023 year high S20.6942*2024 year high
R20.7100*congestion S30.6900**23 Jan high, gap     
R10.7050*congestion S40.6850/00*congestion

Asterisk denotes strength of level

00:20 GMT - Settled back in consolidation just beneath the .7100 level as prices unwind overbought intraday studies. Daily studies are overbought as well and caution corrective pullback to retrace recent strong gains from the .6660, early-January lows. Support starts at the .7000 figure. Below this will open up room for deeper pullback in consolidation towards support at .6942/.6900, the 2024 year high and Friday's high and gap area. Would take break above the .7094 high and the .7100 level to further extend gains from the April low to 2023 year high at .7158 and .7205, 50% Fibonacci level.

Continue to read the article for free
Login

or

or

Topics
AUD/USD-TA
DM-Technical
Technical Analysis

GENERAL

  • Home
  • About Us
  • Our Team
  • Careers

LEGAL

  • Terms and Conditions
  • Privacy Policy
  • Compliance
  • GDPR

GET IN TOUCH

  • Contact Us
Continuum Economics
The Technical Analyst Awards Winner 2021
The Technical Analyst Awards Finalist 2020
image