Published: 2025-11-20T02:13:24.000Z
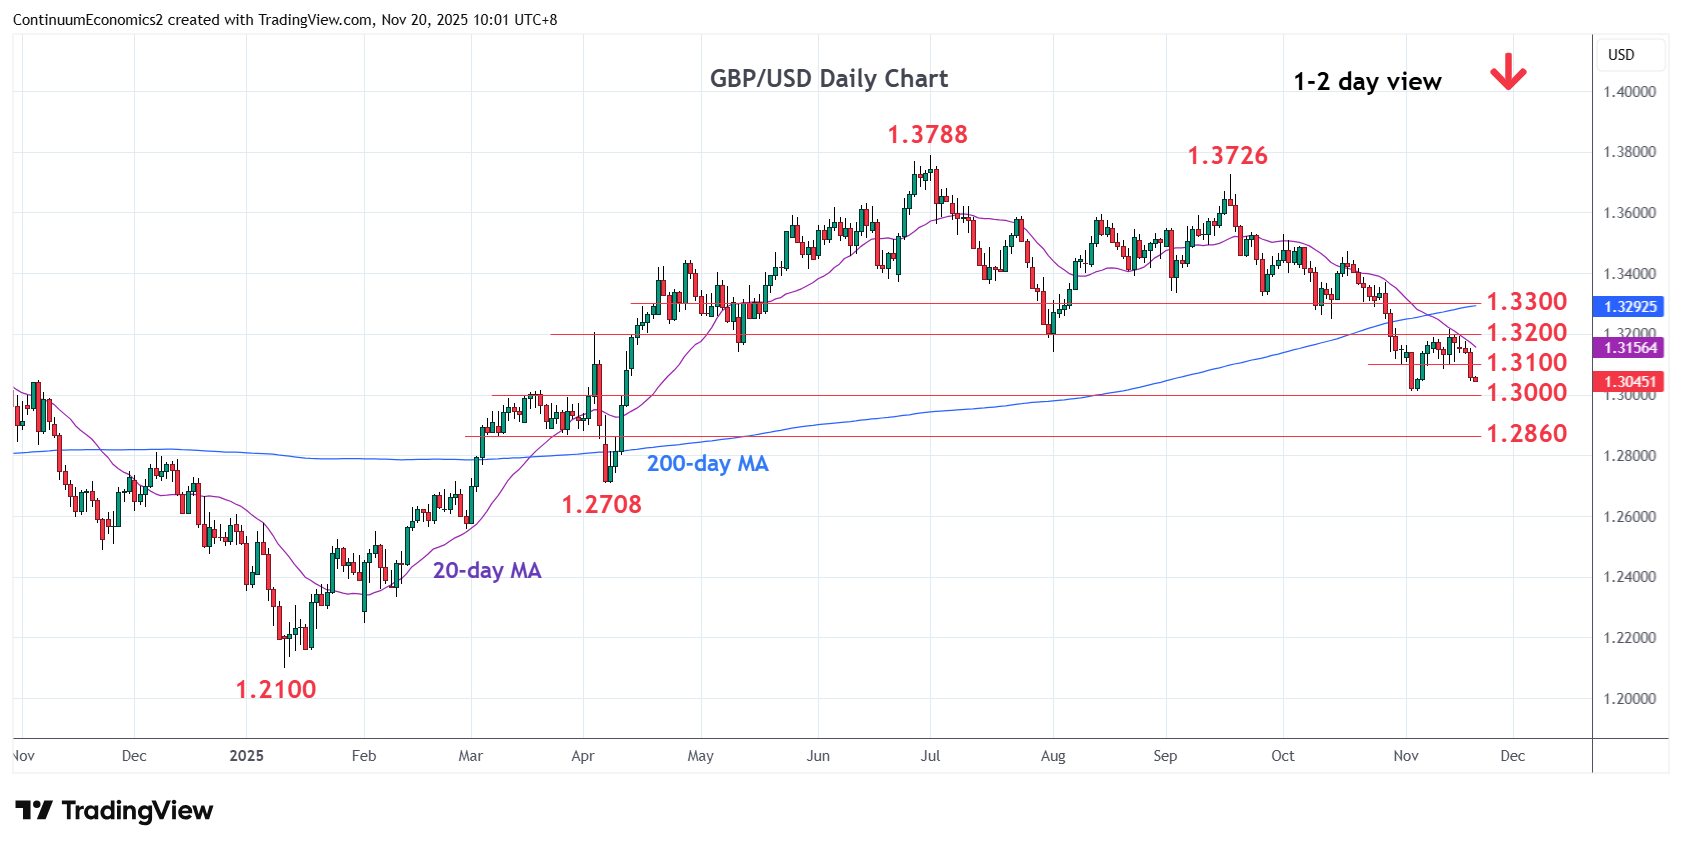
Chart GBP/USD Update: Extending losses, 1.3010 low at risk
2
Break of the 1.3100 level see prices extending pullback from the 1.3200/15 highs of last week
| Level | Comment | Level | Comment | |||||
|---|---|---|---|---|---|---|---|---|
| R4 | 1.3300 | * | congestion | S1 | 1.3010 | ** | 4 Nov low | |
| R3 | 1.3248 | * | 14 Oct low | S2 | 1.2945 | * | 50% Jan/Jul rally | |
| R2 | 1.3200/15 | ** | congestion, 13 Nov high | S3 | 1.2900 | * | congestion | |
| R1 | 1.3100 | * | congestion | S4 | 1.2860 | 10 Mar low |
Asterisk denotes strength of level
02:05 GMT - Break of the 1.3100 level see prices extending pullback from the 1.3200/15 highs of last week and see room for retest of the 1.3010 low. Negative daily studies threatens break here to open up room for deeper pullback to retrace the January/July rally. Lower will see extension to 1.2945, 50% Fibonacci level. Lower still, if seen, will see room to support at 1.2900/1.2860 congestion area. Meanwhile, resistance is lowered to the 1.3100 congestion which is expected to cap and sustain pullback from the 1.3200/15 swing high.