Published: 2026-03-19T05:50:14.000Z
Chart AUD/JPY Update: Lower in consolidation
-
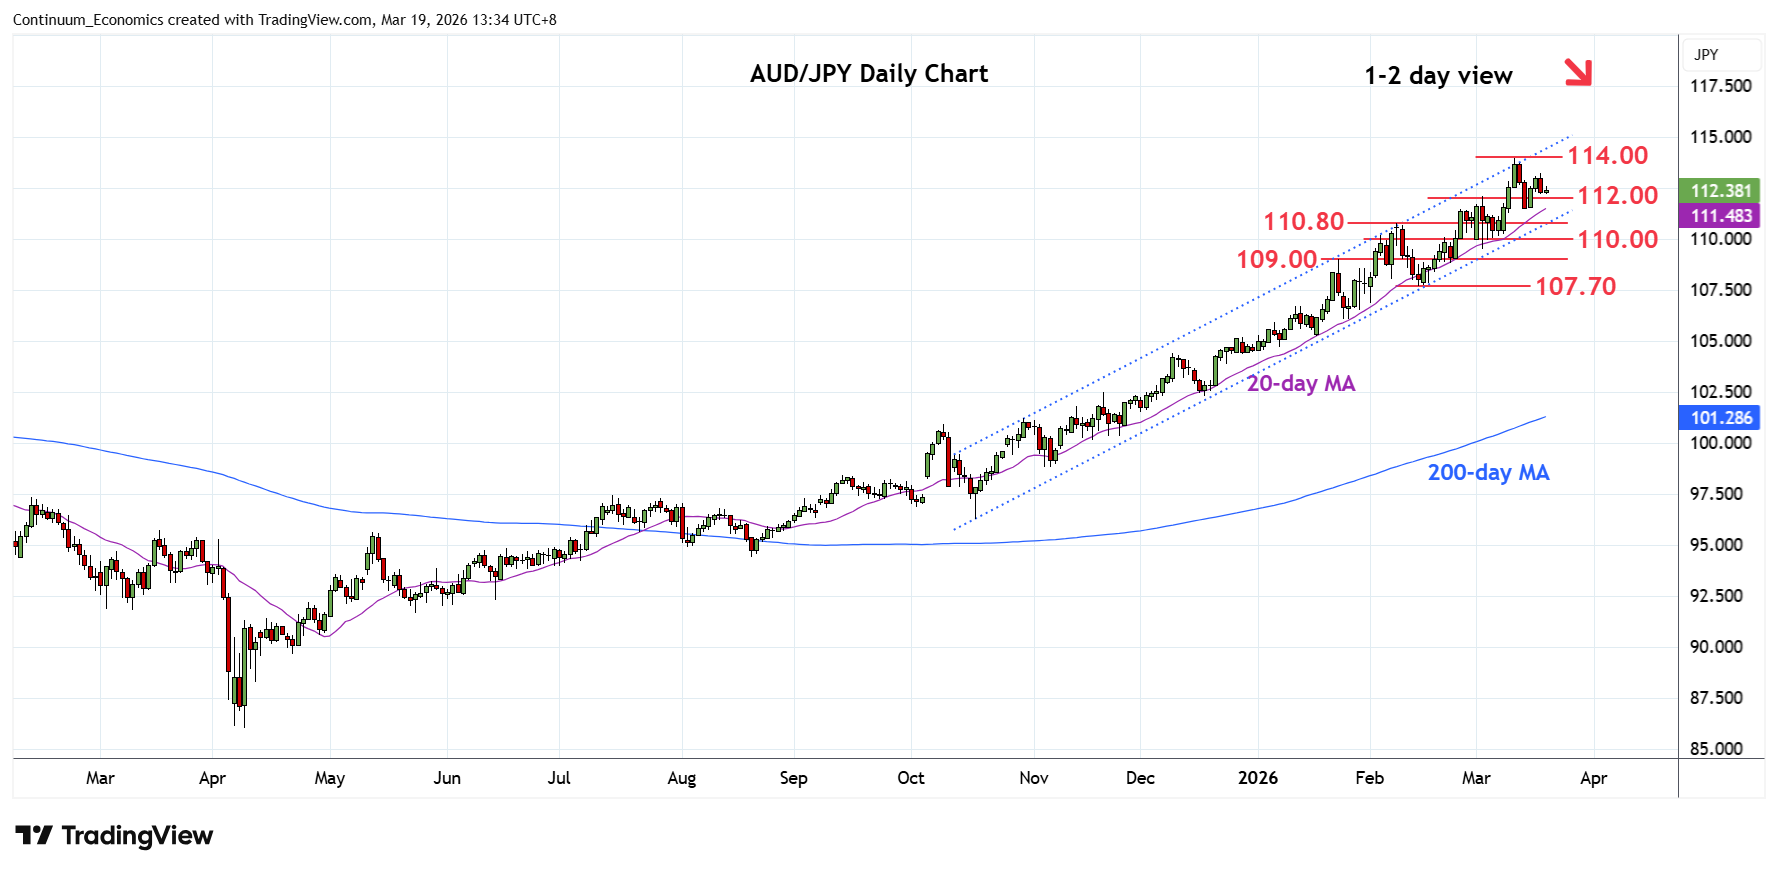
Leaning lower from the 114.00 high and channel resistance from the October low
| Levels | Imp | Comment | Levels | Imp | Comment | |||
|---|---|---|---|---|---|---|---|---|
| R4 | 116.00 | * | congestion | S1 | 111.50 | * | 13 Mar low | |
| R3 | 115.00 | * | congestion | S2 | 110.80 | ** | 9 Feb high | |
| R2 | 114.00 | ** | 11 Mar YTD high | S3 | 110.00 | * | congestion | |
| R1 | 113.20 | * | 18 Mar high | S4 | 109.00 | ** | Jan high |
Asterisk denotes strength of level
05:45 GMT - Leaning lower from the 114.00 high and channel resistance from the October low to consolidate at the 112.00 level. Pullback has seen losses limited to 111.50 low but negative daily and weekly studies and suggest consolidation giving way to renewed selling pressure later. Lower will see room for deeper correction to strong support at the 110.80 /110.00 congestion and 109.00 level. Meanwhile, resistance at the 113.20/114.00 highs are expected to cap. Clearance, if seen, will extend the underlying bull trend to the 115.00/116.00 congestion.