Published: 2025-02-20T15:02:07.000Z
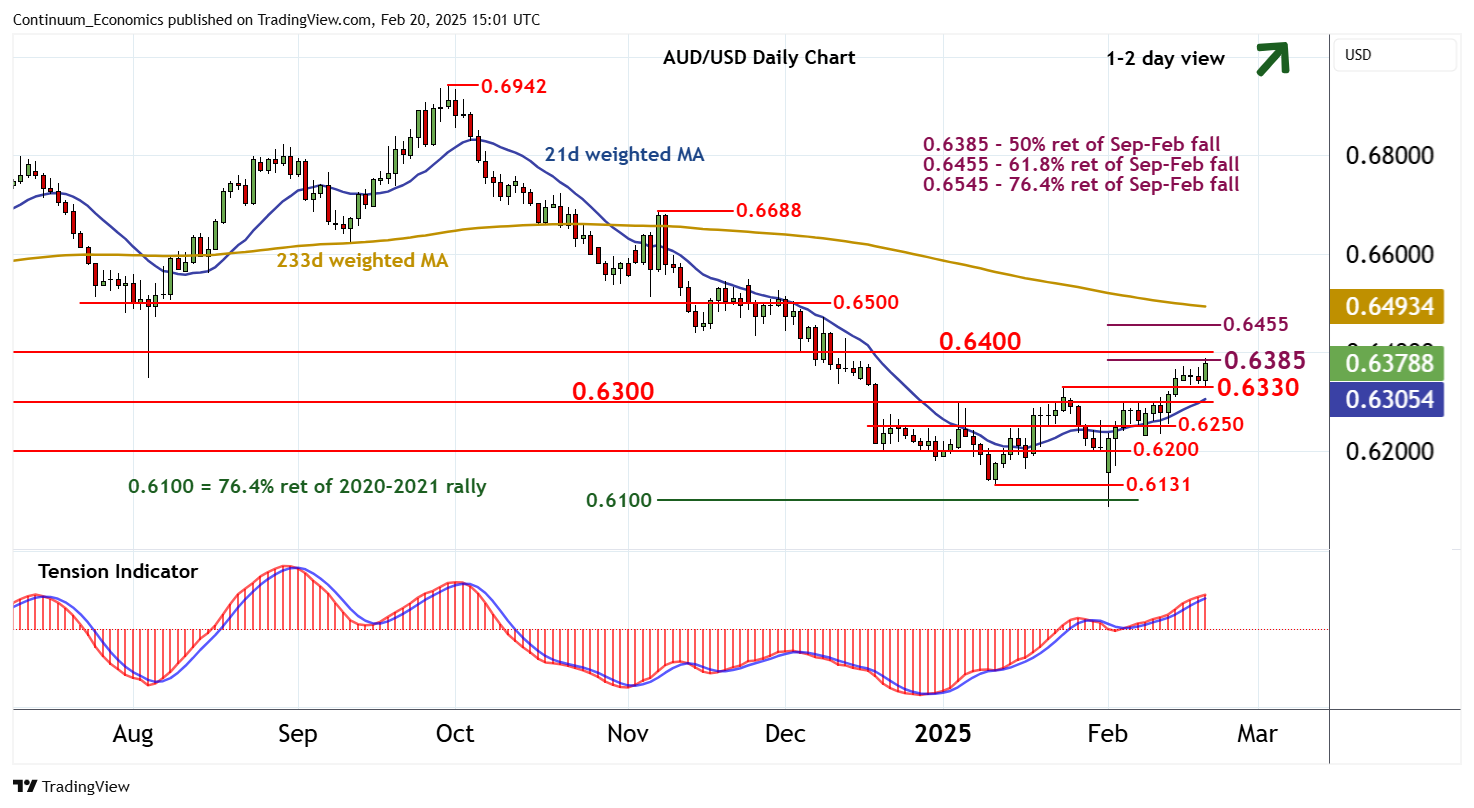
Chart AUD/USD Update: Room for higher

Senior Technical Strategist
-
The test of support at 0.6330 has given way to a bounce
| Levels | Imp | Comment | Levels | Imp | Comment | |||
|---|---|---|---|---|---|---|---|---|
| R4 | 0.6500 | ** | break level | S1 | 0.6330 | * | 24 Jan (m) high | |
| R3 | 0.6455 | ** | 61.8% ret of Sep-Feb fall | S2 | 0.6300 | ** | congestion | |
| R2 | 0.6400 | ** | break level | S3 | 0.6250 | * | break level | |
| R1 | 0.6385 | ** | 50% ret of Sep-Feb fall | S4 | 0.6200 | ** | congestion |
Asterisk denotes strength of level
14:50 GMT - The test of support at 0.6330 has given way to a bounce, with prices currently pressuring resistance at the 0.6385 Fibonacci retracement. Daily stochastics are flat in overbought areas, suggesting further consolidation around here. But the daily Tension Indicator continues to strengthen and broader weekly charts are positive, highlighting room for a later break and extension of February gains beyond the 0.6400 break level towards the 0.6455 retracement. Meanwhile, support within the 0.6300/30 area should underpin any immediate setbacks.