Published: 2026-03-13T12:18:17.000Z
Chart USD/ZAR Update: Pushing higher
1
Cautious trade has given way to a sharp bounce
| Level | Comment | Level | Comment | |||||
|---|---|---|---|---|---|---|---|---|
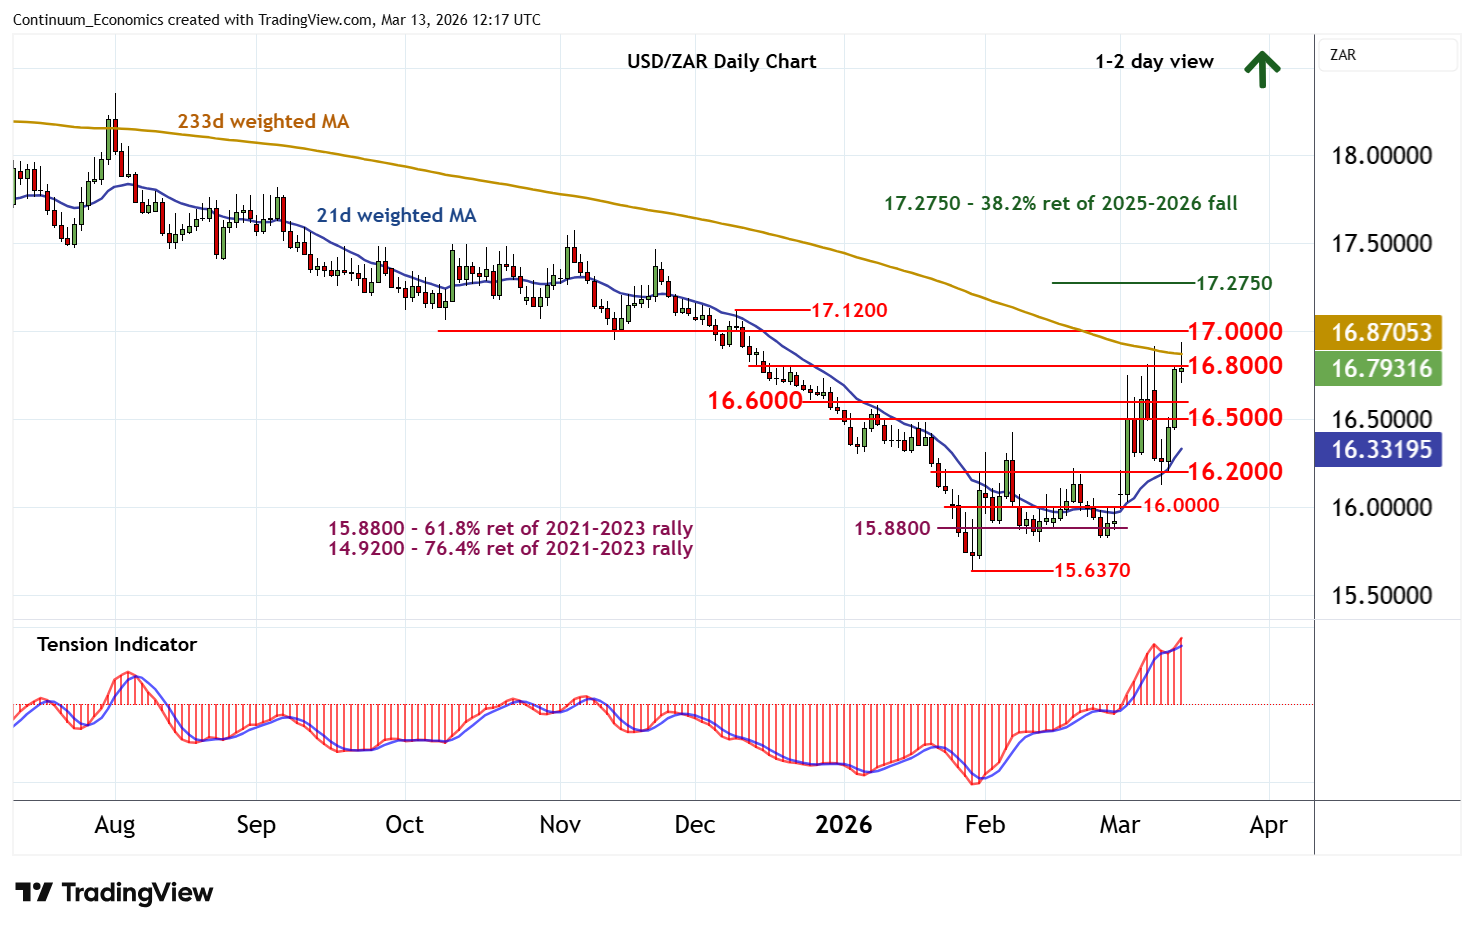
| R4 | 17.2750 | ** | 38.2% ret of 2025-2026 fall | S1 | 16.6000 | break level | ||
| R3 | 17.1200 | * | 9 Dec (w) high | S2 | 16.5000 | break level | ||
| R2 | 17.0000 | * | congestion | S3 | 16.2000 | * | congestion | |
| R1 | 16.8000 | * | break level | S4 | 16.0000 | ** | congestion |
Asterisk denotes strength of level
11:50 GMT - Cautious trade has given way to a sharp bounce, with prices currently consolidating the test of resistance within the 16.8000 - 17.0000 range. Daily readings have turned positive and broader weekly charts continue to rise, highlighting room for further strength in the coming sessions. A close above congestion resistance at 17.0000 will improve sentiment and extend late-January gains towards the 17.2750 Fibonacci retracement. Meanwhile, support is raised to 16.8000 - 17.0000 and should underpin any immediate setbacks.