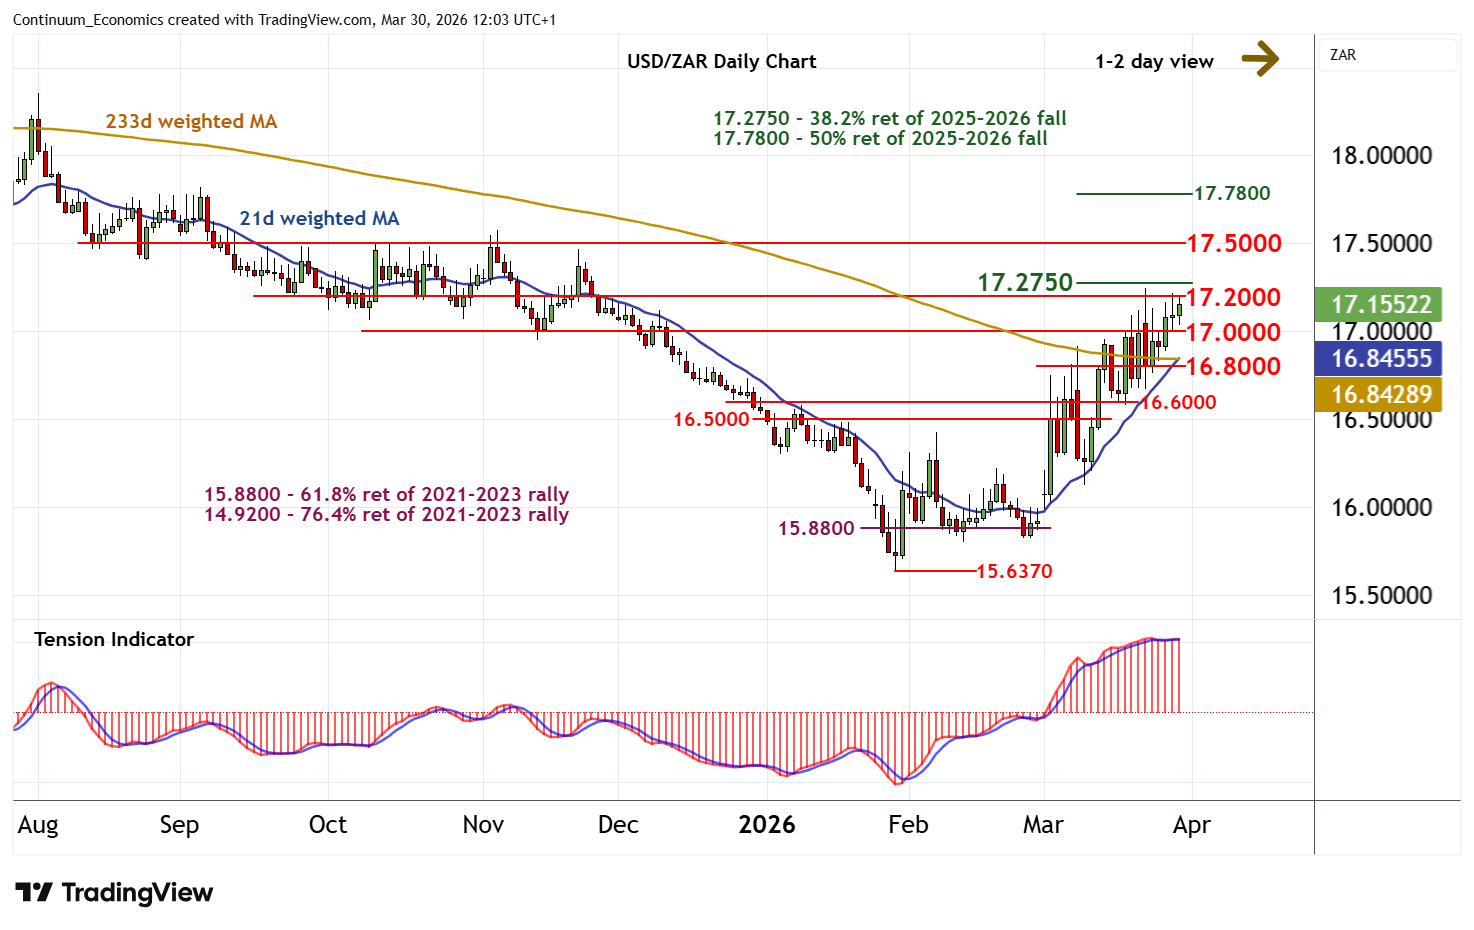
Chart USD/ZAR Update: Consolidating beneath strong resistance at the 17.2750 Fibonacci retracement
Little change, as the flat daily Tension Indicator keeps sentiment cautious
| Level | Comment | Level | Comment | |||||
|---|---|---|---|---|---|---|---|---|
| R4 | 17.7800 | ** | 50% ret of 2025-2026 fall | S1 | 17.0000 | * | congestion | |
| R3 | 17.5000 | ** | break level | S2 | 16.8000 | congestion | ||
| R2 | 17.2750 | ** | 38.2% ret of 2025-2026 fall | S3 | 16.6000 | break level | ||
| R1 | 17.2000 | * | congestion highs | S4 | 16.5000 | break level |
Asterisk denotes strength of level
11:50 BST - Little change, as the flat daily Tension Indicator keeps sentiment cautious and prompts further choppy trade beneath resistance at the 17.2000 congestion highs and the 17.2750 Fibonacci retracement. A tick higher in daily stochastics and positive weekly charts highlight room for further strength in the coming sessions. But a close above here is needed to improve sentiment and extend late-January gains towards resistance at the 17.5000 break level. Meanwhile, support remains at congestion around 17.0000. A close back beneath here, if seen, will help to stabilise price action and prompt consolidation above further congestion around 16.8000.