Published: 2026-04-10T12:14:51.000Z
Chart USD/RUB Update: Extending March losses
4
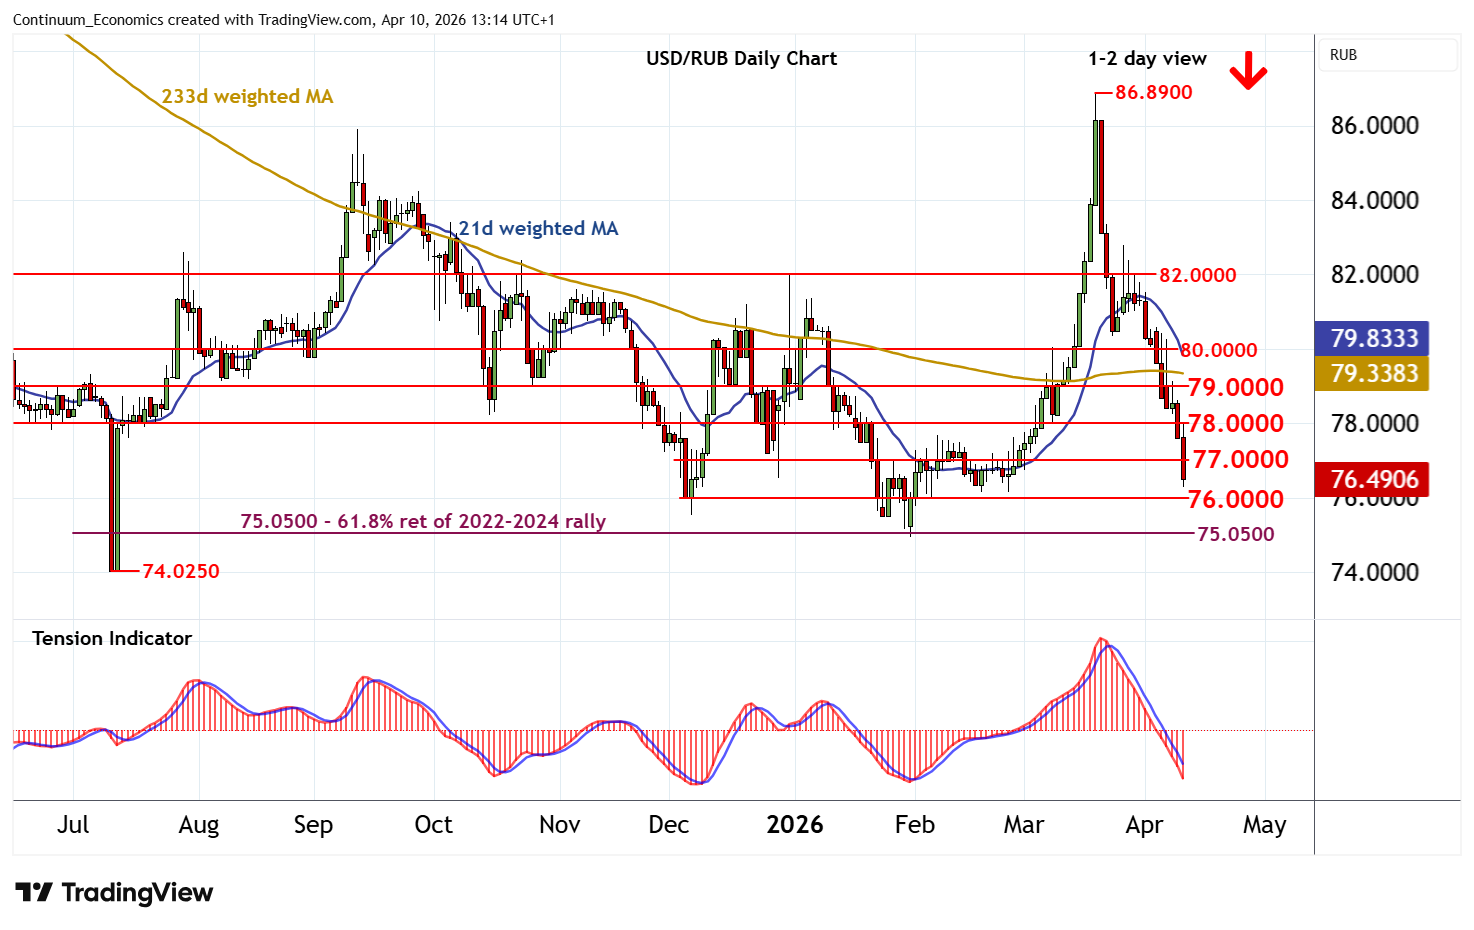
Anticipated losses are extending
| Levels | Comment | Levels | Comment | |||||
| R4 | 81.0000 | * | congestion lows | S1 | 77.0000 | ** | congestion | |
| R3 | 80.0000 | * | break level | S2 | 76.0000 | * | congestion | |
| R2 | 79.0000 | ** | congestion | S3 | 75.0500 | ** | 76.4% ret of 2022-2024 rally | |
| R1 | 78.0000 | * | congestion | S4 | 74.0250 | ** | 10 Jul 2025 (y) low |
Asterisk denotes strength of level
12:50 BST - Anticipated losses are extending, with prices currently pressuring levels around congestion support at 77.0000. Daily readings remain under pressure and broader weekly charts are negative, highlighting room for continuation of mid-March losses towards congestion around 76.0000. Still lower is the 75.0500 multi-month Fibonacci retracement. But already oversold daily stochastics could limit any initial tests in short-covering/consolidation. Meanwhile, resistance is lowered to congestion around 78.0000. A close above here would help to stabilise price action and prompt consolidation beneath 79.0000.