Published: 2026-04-01T00:31:11.000Z
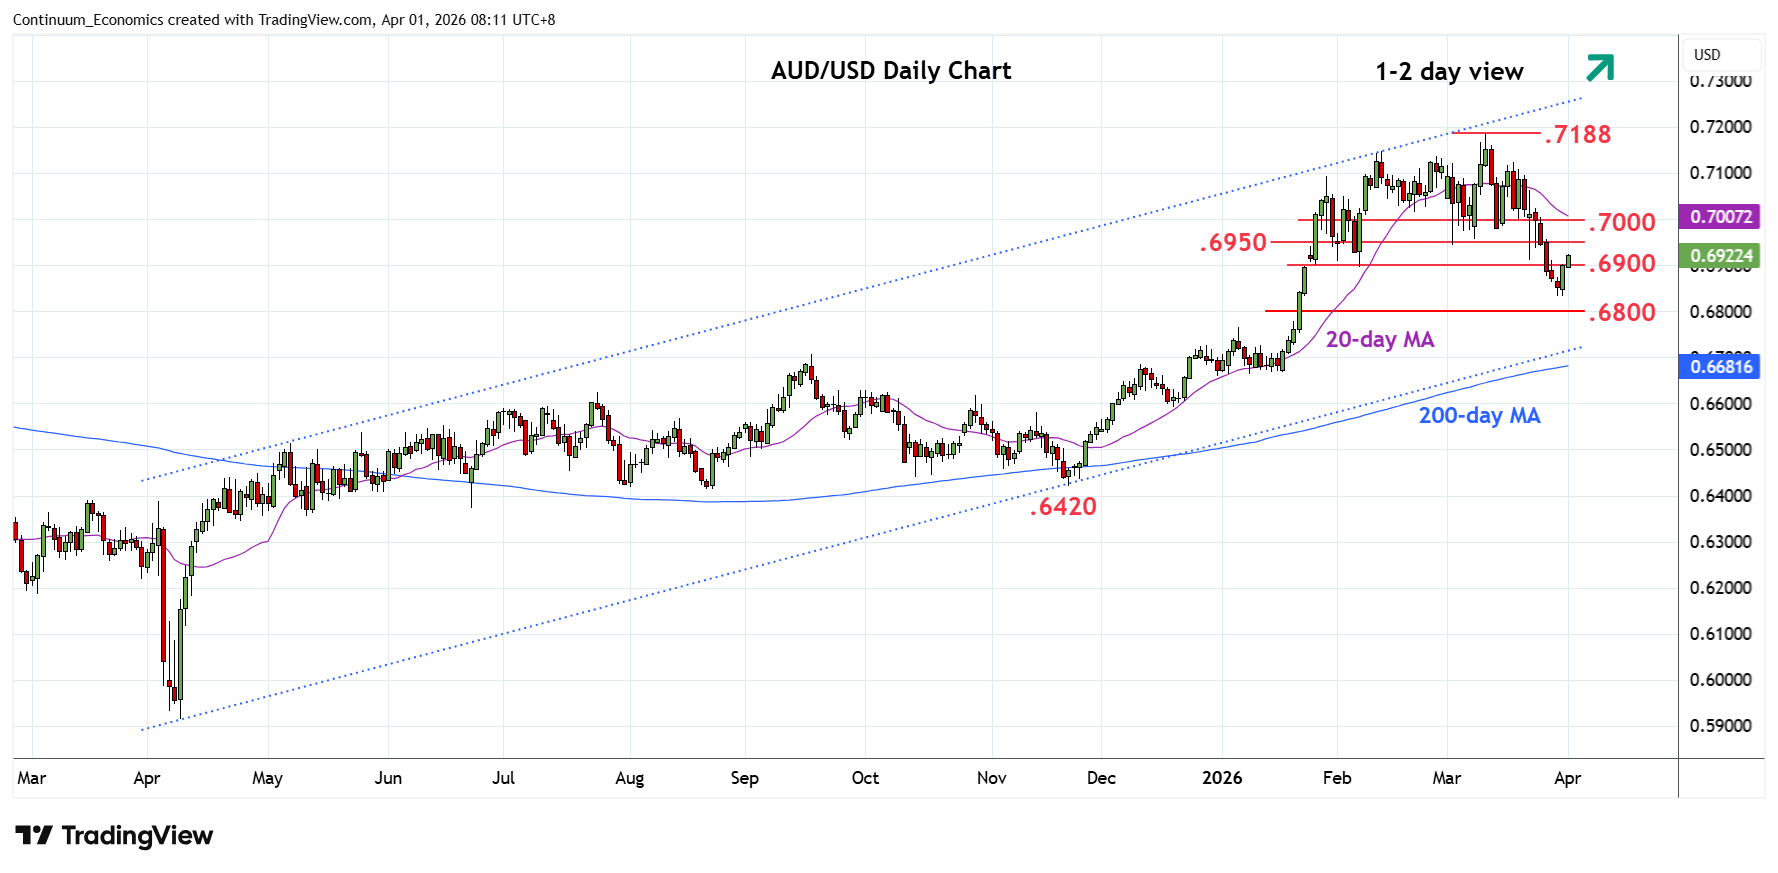
Chart AUD/USD Update: Extending bounce from .6833 low
1
Higher in consolidation with break above the .6900 level extending gains from the .6833 low
| Levels | Imp | Comment | Levels | Imp | Comment | |||
|---|---|---|---|---|---|---|---|---|
| R4 | 0.7050 | * | congestion | S1 | 0.6833 | ** | 30 Mar low | |
| R3 | 0.7000 | ** | congestion | S2 | 0.6805 | * | 50% Nov/Mar rally | |
| R2 | 0.6980 | * | 13 Mar low | S3 | 0.6765 | * | 7 Jan high | |
| R1 | 0.6950 | * | congestion | S4 | 0.6715/00 | ** | 61.8%, congestion |
Asterisk denotes strength of level
00:20 GMT - Higher in consolidation with break above the .6900 level extending gains from the .6833 low as daily studies unwind oversold readings. Higher will see room to resistance at the .6950/80 congestion and 13 March low. This area and the .7000 level expected to cap and give way to renewed selling pressure later. A later break of the .6833 low will see room to .6805 50% Fibonacci level. Below this will open up room for extension to support at .6765 then the strong support zone at .6715/.6700 area and channel support.