Published: 2026-05-05T13:22:40.000Z
Chart AUD/USD Update: Pullback from year highs
1
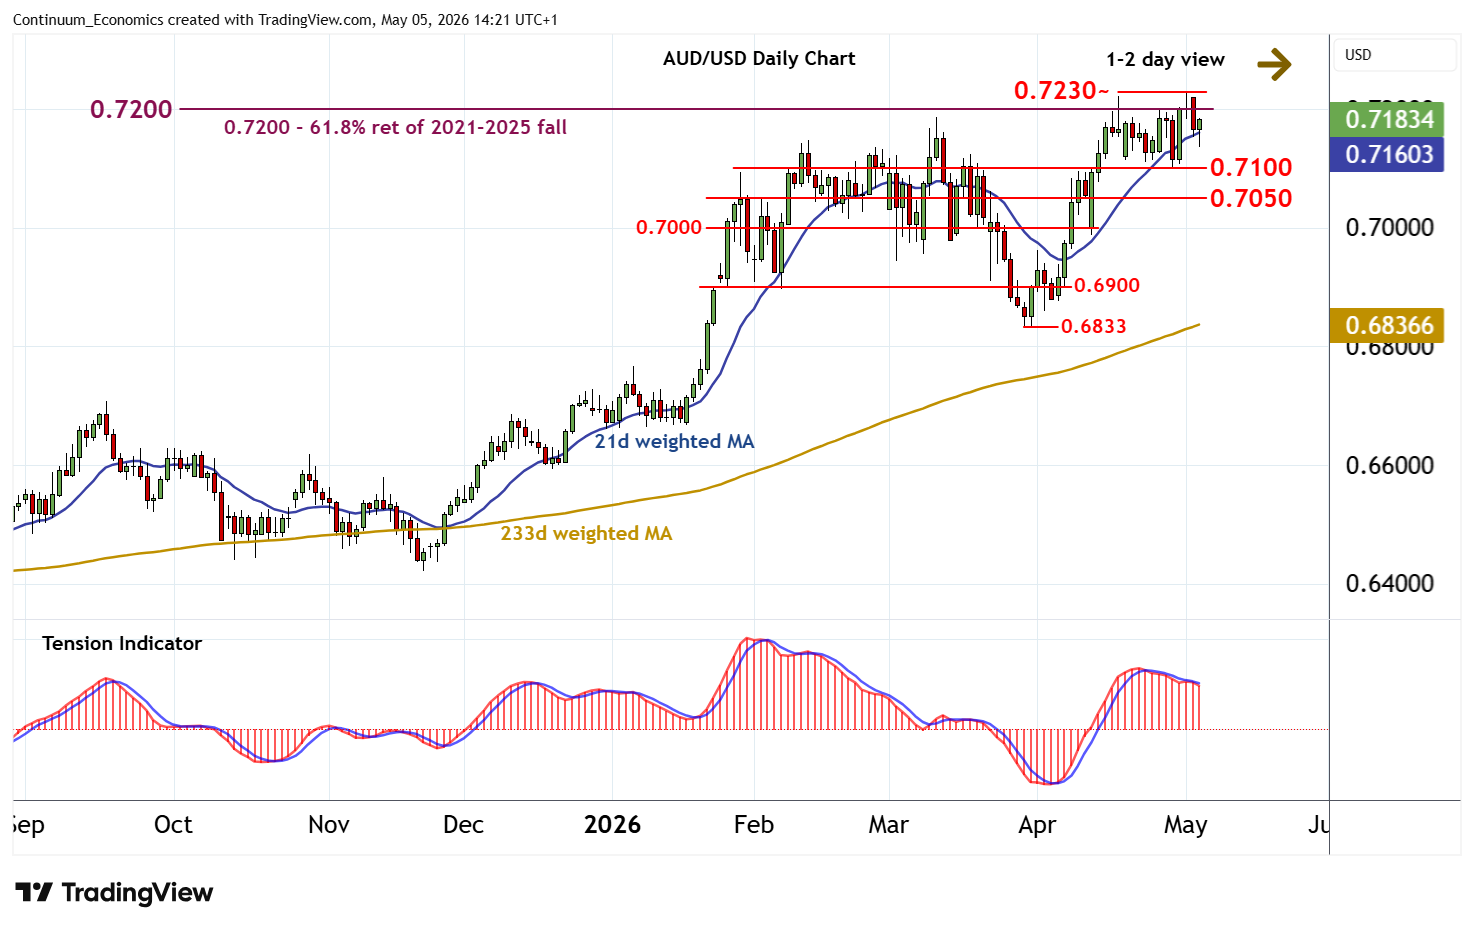
The push to fresh year highs around 0.7230~ has given way to profit-taking
| Levels | Imp | Comment | Levels | Imp | Comment | |||
|---|---|---|---|---|---|---|---|---|
| R4 | 0.7400 | ** | historic congestion | S1 | 0.7100 | congestion | ||
| R3 | 0.7280~ | ** | June 2022 high | S2 | 0.7050 | * | congestion | |
| R2 | 0.7230~ | * | 1 May YTD high | S3 | 0.7000 | * | congestion | |
| R1 | 0.7200 | ** | 61.8% ret of 2021-2025 fall | S4 | 0.6960 | * | 1 Apr (w) high |
Asterisk denotes strength of level
14:15 BST - The push to fresh year highs around 0.7230~ has given way to profit-taking, with prices currently trading around 0.7185. Daily readings are turning down and broader weekly charts are turning mixed/negative, highlighting room for further losses in the coming sessions. Support remains at 0.7100. But oversold intraday studies should limit any initial tests in consolidation. Meanwhile, a close above 0.7230~, if seen, will turn sentiment positive and extend April 2025 gains towards the 0.7280~ high of June 2022.