Published: 2026-03-31T07:35:05.000Z
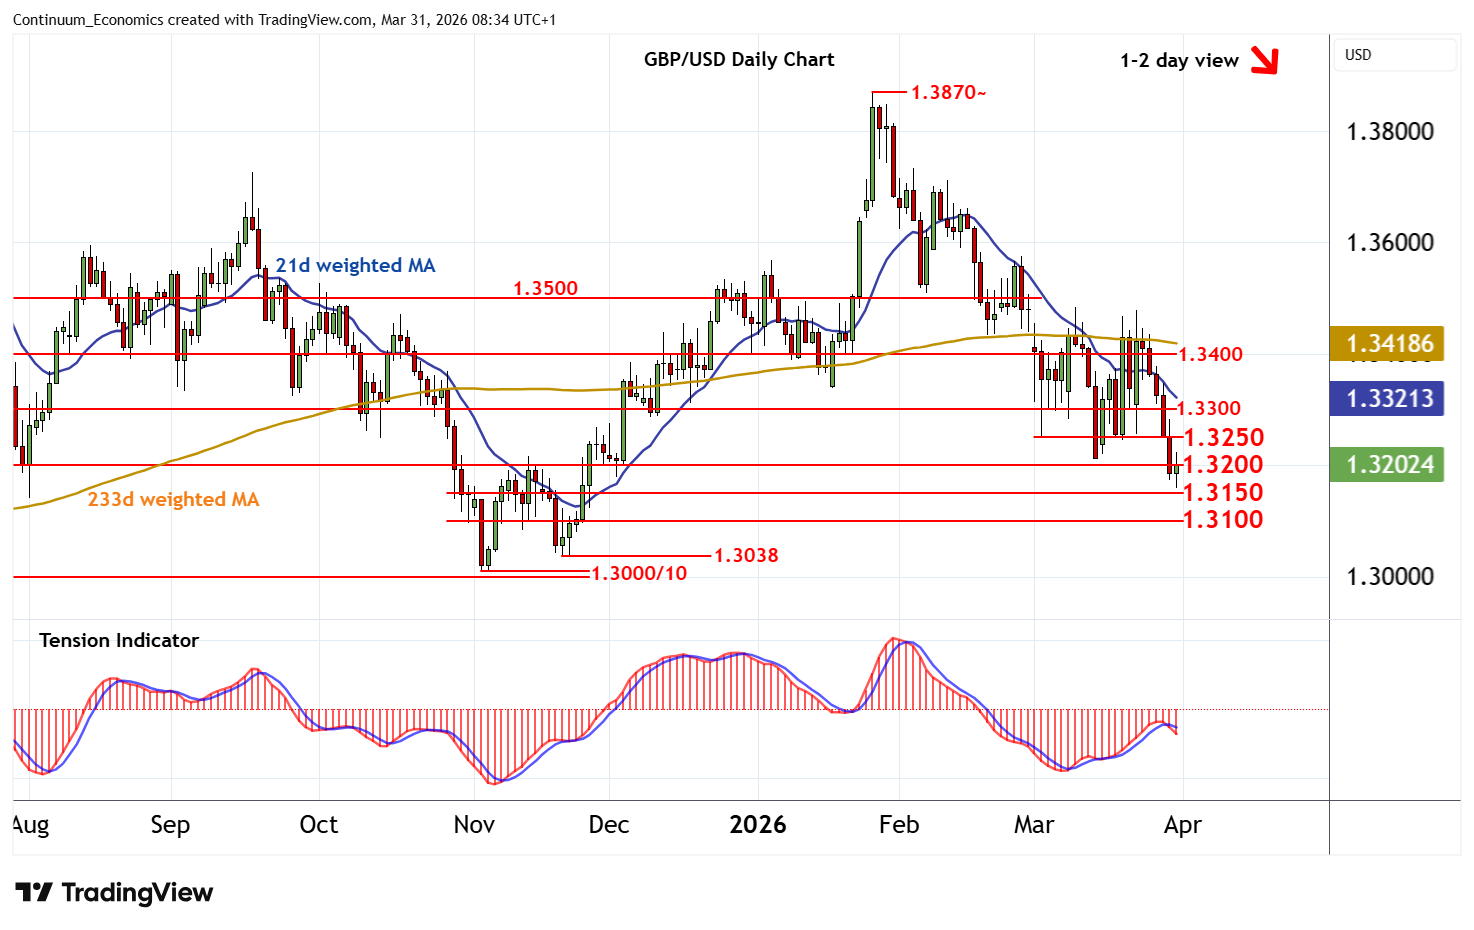
Chart GBP/USD Update: Fresh year low
3
Anticipated losses have posted a fresh 2026 year low at 1.3160
| Level | Comment | Level | Comment | |||||
|---|---|---|---|---|---|---|---|---|
| R4 | 1.3400 | ** | congestion | S1 | 1.3150/60 | * | congestion; current YTD low | |
| R3 | 1.3300 | * | congestion | S2 | 1.3100 | * | congestion | |
| R2 | 1.3250 | * | congestion | S3 | 1.3038 | * | 20-21 Nov (w) low | |
| R1 | 1.3200 | * | congestion | S4 | 1.3000/10 | ** | cong; 4-5 Nov (m) low |
Asterisk denotes strength of level
08:10 BST - Anticipated losses have posted a fresh 2026 year low at 1.3160, before settling into consolidation around congestion resistance at 1.3200 as negative intraday studies flatten. A test above here cannot be ruled out. But negative daily readings and mixed/negative weekly charts suggest renewed selling interest towards further congestion around 1.3250. Following cautious/corrective trade, fresh losses are looked for. Support is at congestion around 1.3150. A later break beneath here will add weight to sentiment and extend late-January losses towards further congestion around 1.3100.