Published: 2026-03-24T08:48:50.000Z
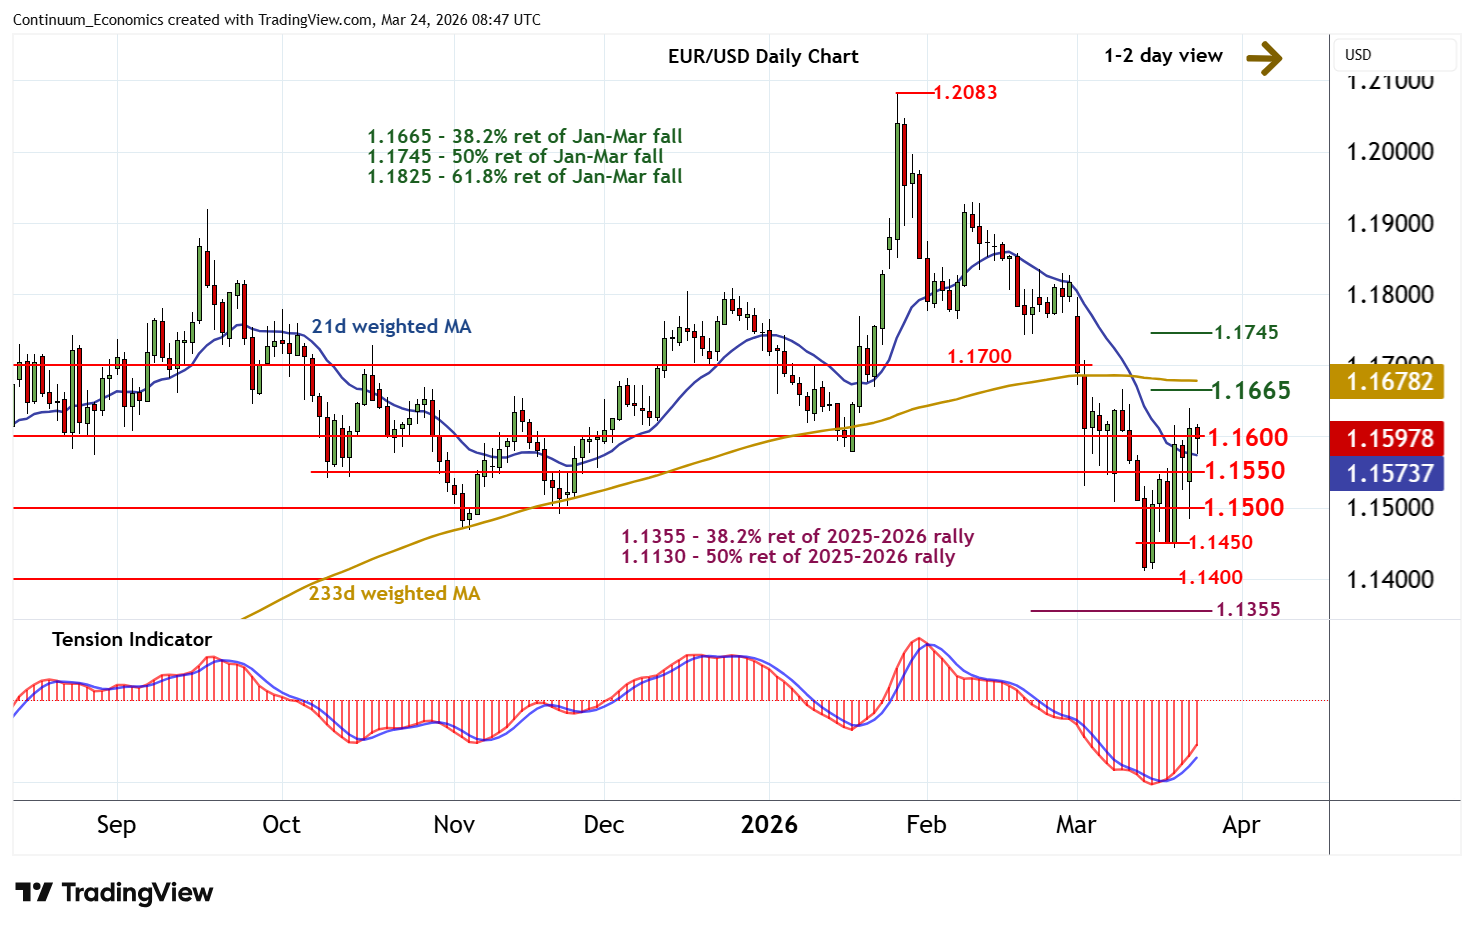
Chart EUR/USD Update: Heightened volatility - strong resistance at 1.1665
1
The anticipated test of congestion support at 1.1500 has given way to a sharp bounce
| Levels | Imp | Comment | Levels | Imp | Comment | |||
|---|---|---|---|---|---|---|---|---|
| R4 | 1.1700 | * | congestion | S1 | 1.1550 | * | congestion | |
| R3 | 1.1665~ | * | 10 Mar (w) high, 38.2% ret | S2 | 1.1500 | ** | congestion | |
| R2 | 1.1640 | 23 Mar high | S3 | 1.1450 | recent lows, congestion | |||
| R1 | 1.1600 | ** | congestion | S4 | 1.1400/10 | * | congestion; 13 Mar YTD low |
*Asterisk denotes strength of level
08:30 GMT - The anticipated test of congestion support at 1.1500 has given way to a sharp bounce, with prices reaching 1.1640 before settling into fresh consolidation beneath 1.1600. The daily Tension Indicator is rising, suggesting room for a fresh test higher. But flat overbought daily stochastics and negative weekly charts should limit scope in renewed selling interest towwards the 1.1665 Fibonacci retracement. Meanwhile, support is at congestion around 1.1550 and extends to 1.1500. This range should underpin any immediate setbacks.