Published: 2026-02-26T12:45:22.000Z
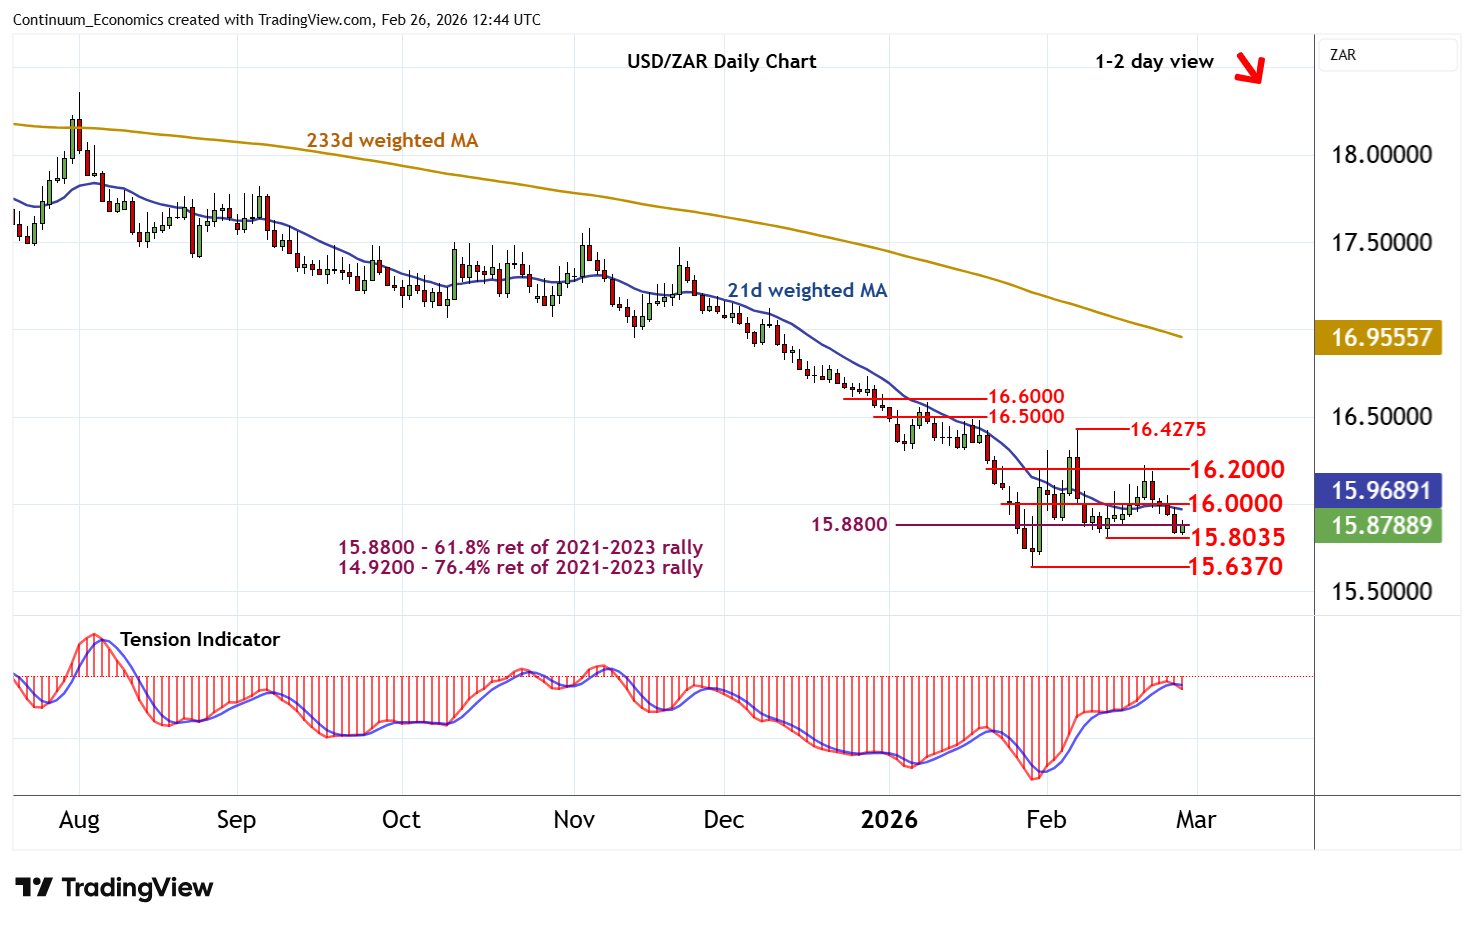
Chart USD/ZAR Update: Consolidating - background studies under pressure
2
The anticipated test of support at the 15.8035 weekly low of 12 February is giving way to expected consolidation
| Level | Comment | Level | Comment | |||||
|---|---|---|---|---|---|---|---|---|
| R4 | 16.5000 | break level | S1 | 15.8035 | * | 12 Feb (w) low | ||
| R3 | 16.4275 | * | 6 Feb (w) high | S2 | 15.6370 | ** | 29 Jan YTD low | |
| R2 | 16.2000 | minor congestion | S3 | 15.1665 | * | June 2022 low | ||
| R1 | 16.0000 | ** | congestion | S4 | 15.0000 | ** | congestion |
Asterisk denotes strength of level
12:15 GMT - The anticipated test of support at the 15.8035 weekly low of 12 February is giving way to expected consolidation, as oversold intraday studies unwind. A minor test higher is developing, but negative daily readings should limit scope in renewed selling interest beneath congestion resistance at 16.0000. In the coming sessions, cautious trade is looked for, before mixed/negative weekly charts and bearish longer-term readings prompt further losses. A later break below 15.8035 will open up critical support at the 15.6370 current year low of 29 January.