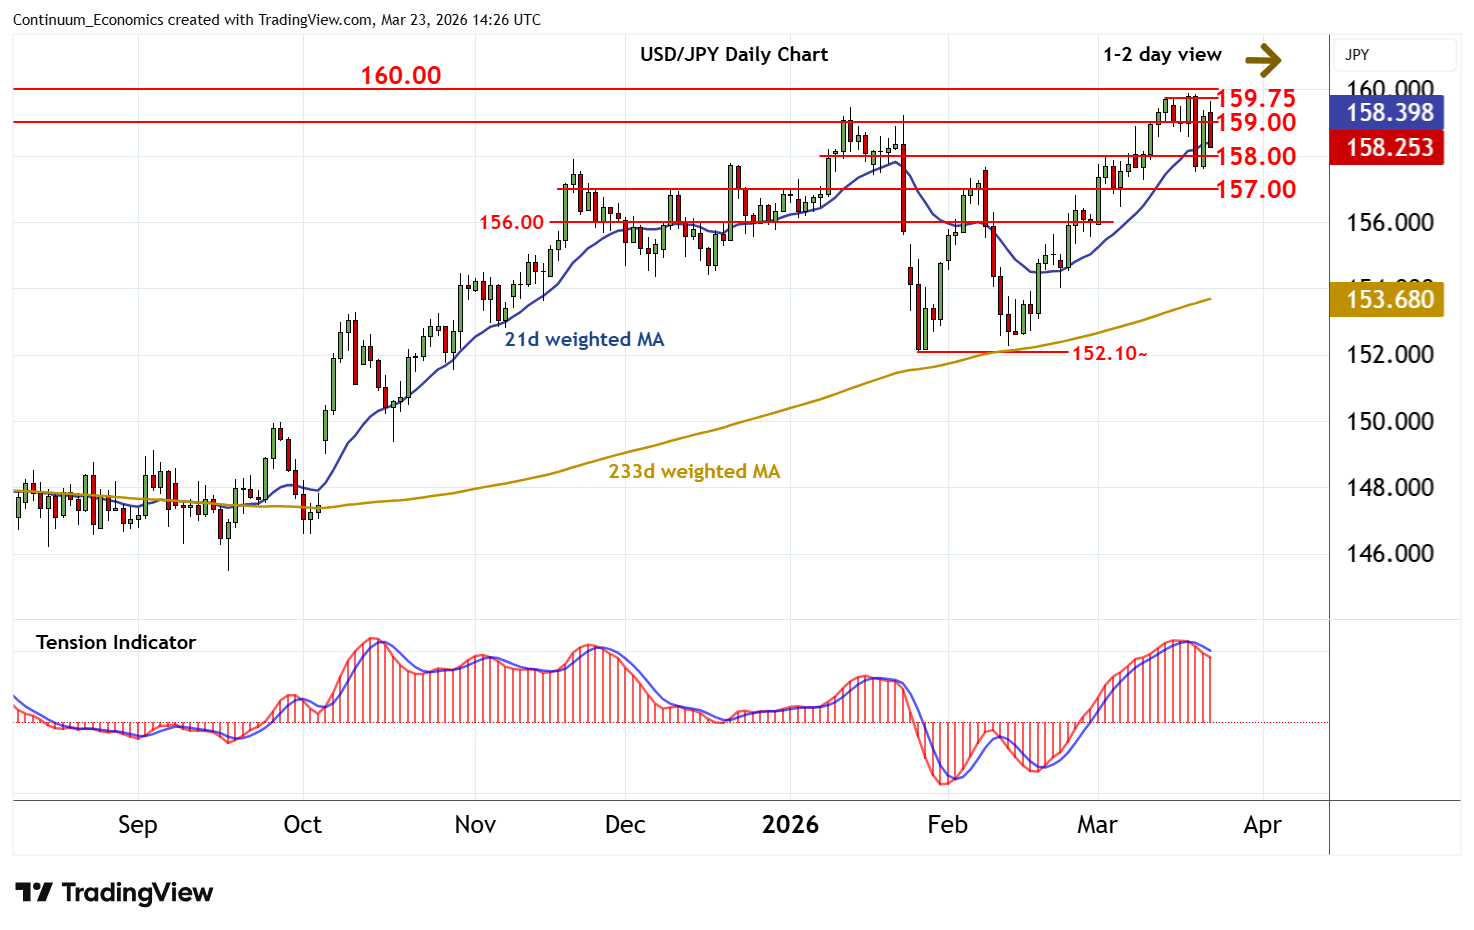
Chart USD/JPY Update: Choppy at highs
The anticipated test above congestion resistance at 159.00 has been pushed back from strong resistance at the 159.75 current year high of 13 March
| Levels | Imp | Comment | Levels | Imp | Comment | |||
|---|---|---|---|---|---|---|---|---|
| R4 | 160.40 | ** | April 1990 (y) high | S1 | 158.00 | * | break level | |
| R3 | 160.00 | ** | historic congestion | S2 | 157.50 | 19 Mar low | ||
| R2 | 159.75 | ** | 13 Mar YTD high | S3 | 157.00 | congestion | ||
| R1 | 159.00 | * | congestion | S4 | 156.45 | * | 4 Mar low |
Asterisk denotes strength of level
14:10 GMT - The anticipated test above congestion resistance at 159.00 has been pushed back from strong resistance at the 159.75 current year high of 13 March, as intraday studies turn down, with immediate focus turning to support at the 158.00 break level. Daily stochastics and the daily Tension Indicator are also falling, highlighting potential for continuation beneath here. But daily stochastics are approaching oversold areas and broader weekly charts are rising, suggesting initial scope should be limited in consolidation above congestion around 157.00. Meanwhile, resistance remains at 159.00. But a close above the 160.40 year high of April 1990 is needed to turn sentiment positive and confirm continuation of long-term bull trends.