Published: 2025-10-17T08:30:19.000Z
Chart USD/CHF Update: Lower in both USD- and CHF-driven trade
-
Anticipated losses have reached congestion support at 0.7900 in both USD- and CHF-driven trade
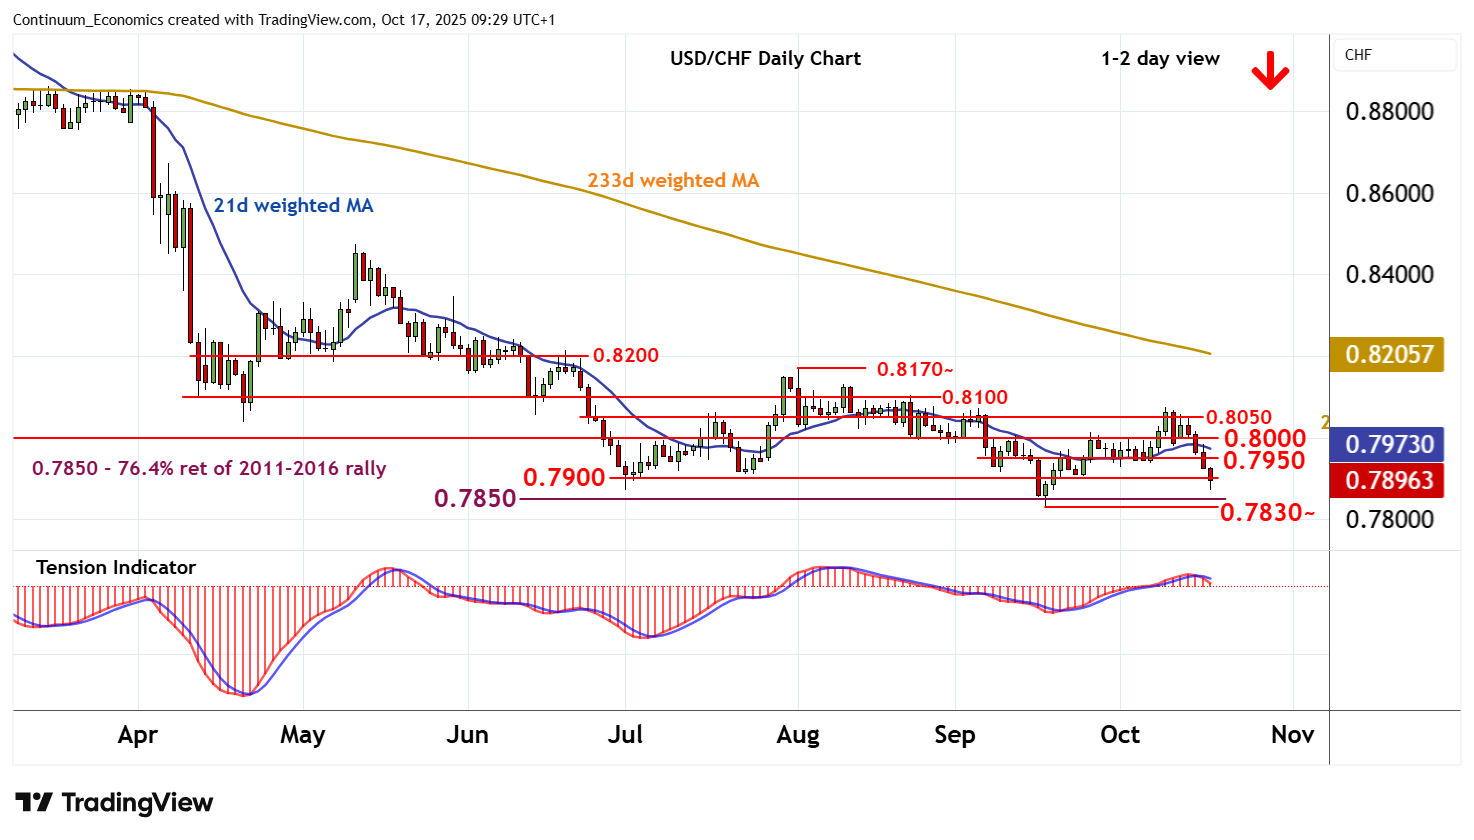
| Level | Comment | Level | Comment | |||||
|---|---|---|---|---|---|---|---|---|
| R4 | 0.8075 | 9 Oct (w) high | S1 | 0.7900 | congestion | |||
| R3 | 0.8050 | break level | S2 | 0.7850 | ** | 76.4% ret of 2011-2016 rally | ||
| R2 | 0.8000 | ** | congestion | S3 | 0.7830~ | ** | 17 Sep YTD low | |
| R1 | 0.7950 | * | recent lows | S4 | 0.7800 | figure |
Asterisk denotes strength of level
09:20 BST - Anticipated losses have reached congestion support at 0.7900 in both USD- and CHF-driven trade, where flat oversold intraday studies are prompting choppy trade. Daily readings continue to fall, highlighting room for continuation towards critical support at the 0.7850 Fibonacci retracement and the 0.7830~ current year low of 17 September. But mixed weekly charts are expected to limit any initial tests in consolidation, before bearish longer-term readings prompt further losses. Meanwhile, resistance is lowered to 0.7950, and should cap any immediate tests higher.