Published: 2026-04-17T13:05:37.000Z
Chart USD/JPY Update: Leaning lower in range
5
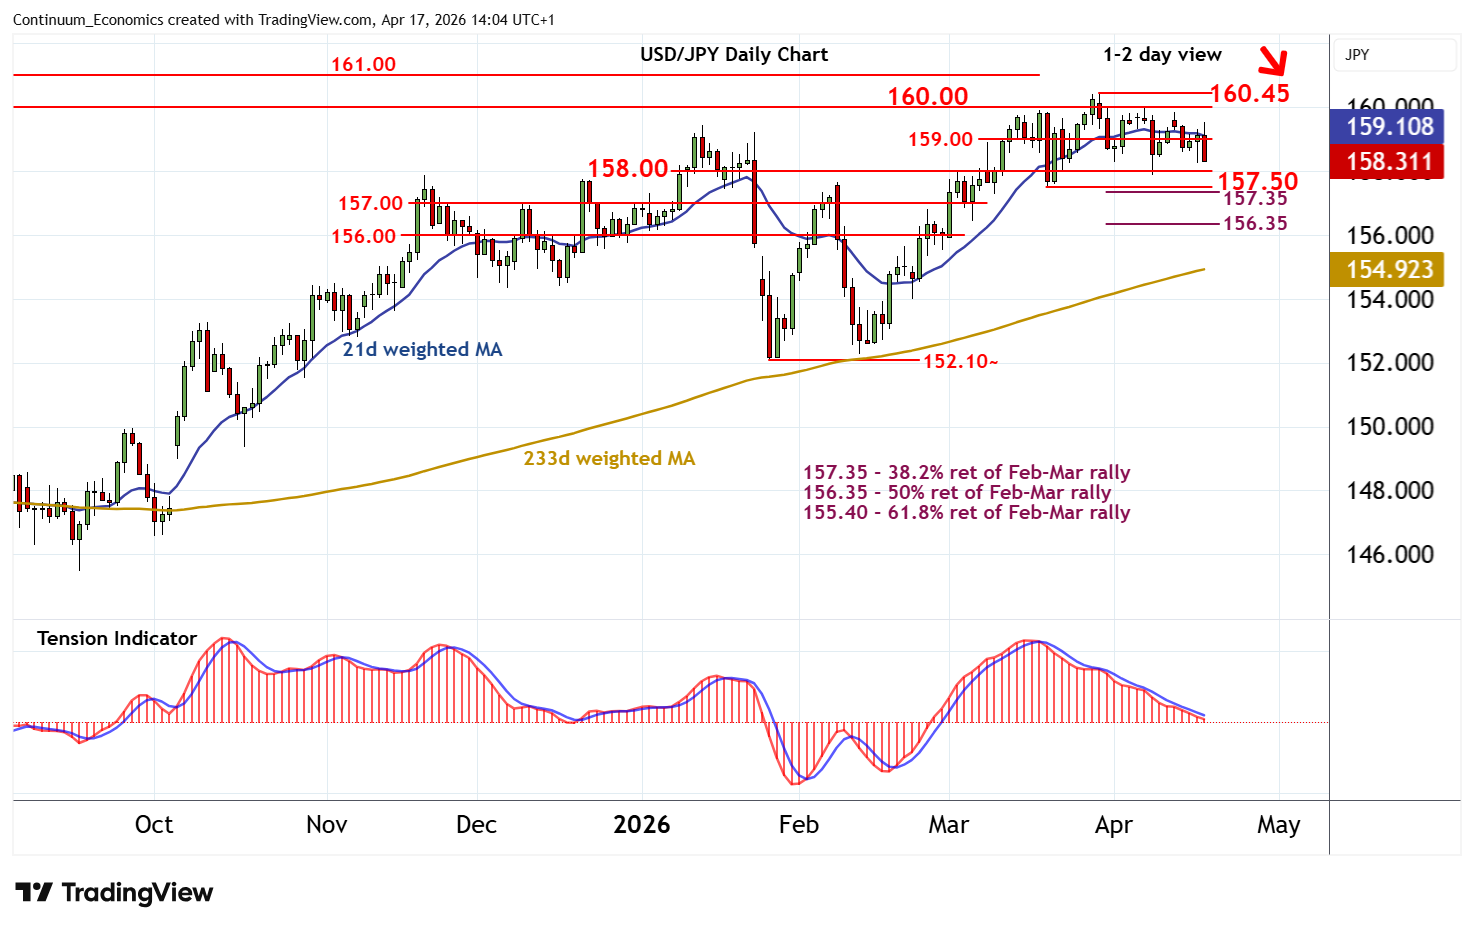
The anticipated test above congestion resistance at 159.00 has met sharp selling interest around 159.50
| Levels | Imp | Comment | Levels | Imp | Comment | |||
|---|---|---|---|---|---|---|---|---|
| R4 | 161.00 | * | July 2024 congestion | S1 | 158.00 | ** | congestion | |
| R3 | 160.45 | ** | 30 Mar YTD high | S2 | 157.35/50 | ** | 38.2% ret; 19 Mar (w) low | |
| R2 | 160.00 | ** | historic congestion | S3 | 157.00 | * | congestion | |
| R1 | 159.00 | * | congestion | S4 | 156.35 | ** | 50% ret of Feb-Mar rally |
Asterisk denotes strength of level
13:45 BST - The anticipated test above congestion resistance at 159.00 has met sharp selling interest around 159.50, with prices currently trading around 158.50. Daily readings are bearish and broader weekly charts are under pressure, highlighting room for continuation down to congestion support at 158.00. However, a further close below the 157.50 weekly low of 19 March will add weight to sentiment and open up the 157.35 Fibonacci retracement, ahead of congestion around 157.00. Meanwhile, a close back above 159.00, if seen, will help to stabilise price action and prompt consolidation beneath 160.00.