Published: 2025-11-26T00:16:10.000Z
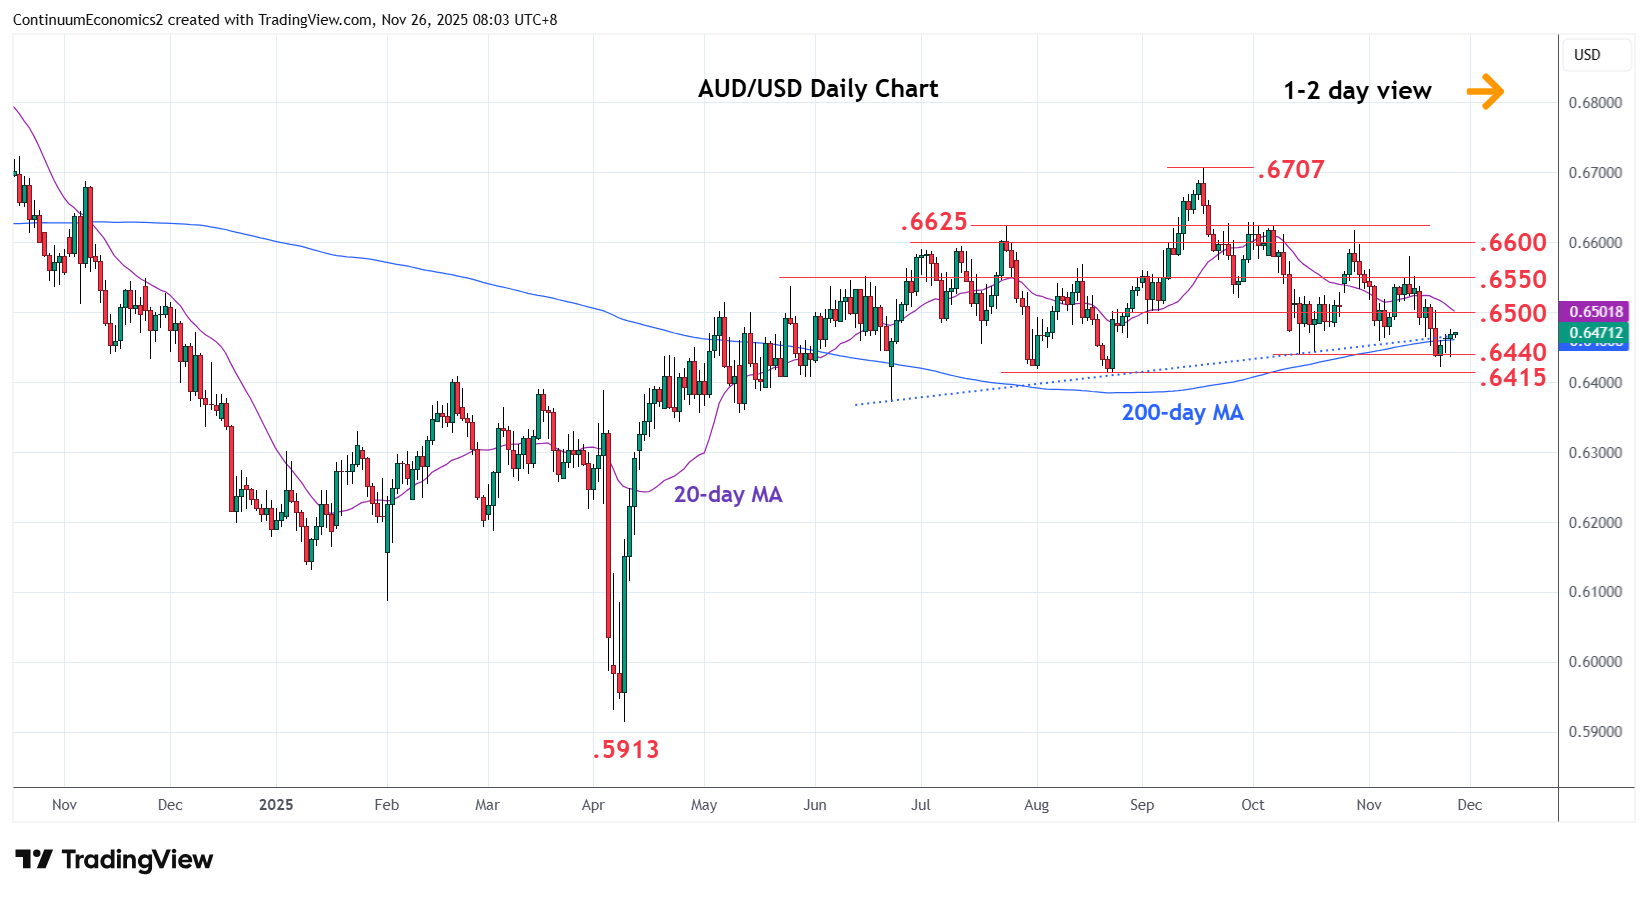
Chart AUD/USD Update: Higher in consolidation
-
No follow-through on break of the .6440 support as prices turned up from above the .6415 support to consolidate losses from the recent .6580 swing high
| Levels | Imp | Comment | Levels | Imp | Comment | |||
|---|---|---|---|---|---|---|---|---|
| R4 | 0.6625/30 | ** | Jul, Oct highs | S1 | 0.6440 | ** | Oct low | |
| R3 | 0.6600 | * | congestion | S2 | 0.6415/00 | ** | Aug low, 38.2% | |
| R2 | 0.6550 | * | congestion | S3 | 0.6372 | Jun low | ||
| R1 | 0.6500/20 | * | congestion, 26 Sep low | S4 | 0.6356/50 | * | May low, congestion |
Asterisk denotes strength of level
00:10 GMT - No follow-through on break of the .6440 support as prices turned up from above the .6415 support to consolidate losses from the recent .6580 swing high. Daily studies are unwinding oversold readings and see room for bounce to the .6500/20 resistance which is expected to cap. Only above here will see room for stronger corrective bounce to resistance at the .6550 congestion. Would take close below the .6440 support to see deeper pullback to retrace the April/September rally towards .6415/00 support and 38.2% Fibonacci level.