Chart AUD/USD Update: Consolidating beneath the 2025 year highs
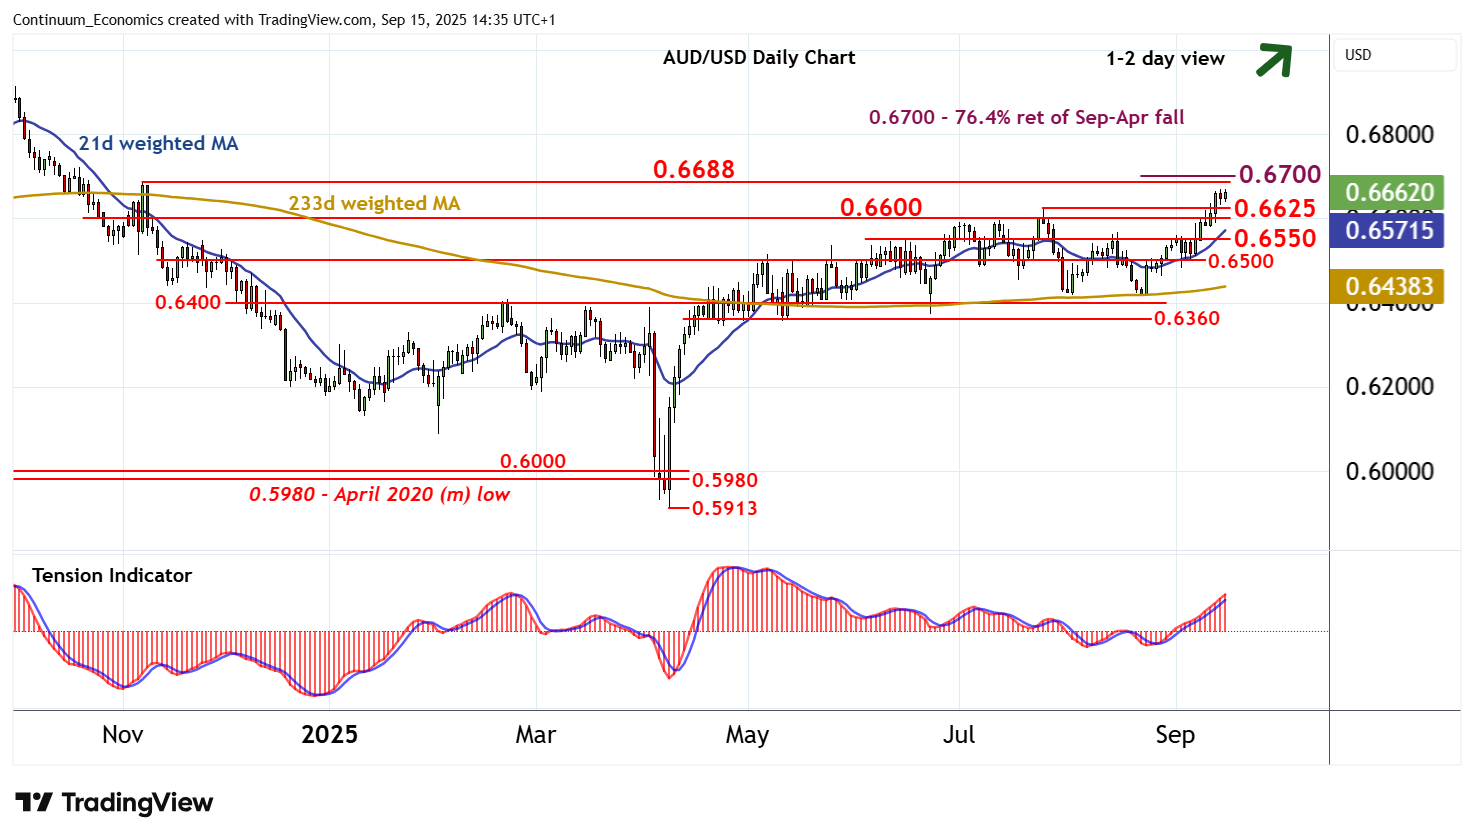
Little change, as prices extend cautious trade beneath the 0.6668 current year high of 12 September
| Levels | Imp | Comment | Levels | Imp | Comment | |||
|---|---|---|---|---|---|---|---|---|
| R4 | 0.6723 | 21 Oct (w) high | S1 | 0.6625 | ** | 24 Jul (m) high | ||
| R3 | 0.6700 | ** | 76.4% ret of Sep-Apr fall | S2 | 0.6600 | ** | congestion | |
| R2 | 0.6688 | ** | 7 Nov (m) high | S3 | 0.6550 | * | congestion | |
| R1 | 0.6668~ | 12 Sep YTD high | S4 | 0.6500 | * | congestion |
Asterisk denotes strength of level
14:25 BST - Little change, as prices extend cautious trade beneath the 0.6668 current year high of 12 September. Overbought daily stochastics are turning down, suggesting potential for further consolidation beneath here. But the daily Tension Indicator continue to track higher and broader weekly charts are improving, pointing to room for a later break above here and continuation of April gains towards the 0.6688 monthly high of 7 November and the 0.6700 Fibonacci retracement. Initial tests of this range could give way to consolidation. Meanwhile, support remains at congestion around 0.6600 and the 0.6525 monthly high of 24 July. A close beneath here, if seen, will give way to consolidation above further congestion around 0.6550.