Published: 2026-04-13T07:59:59.000Z
Chart USD Index DXY Update: Opening gains not sustained
1
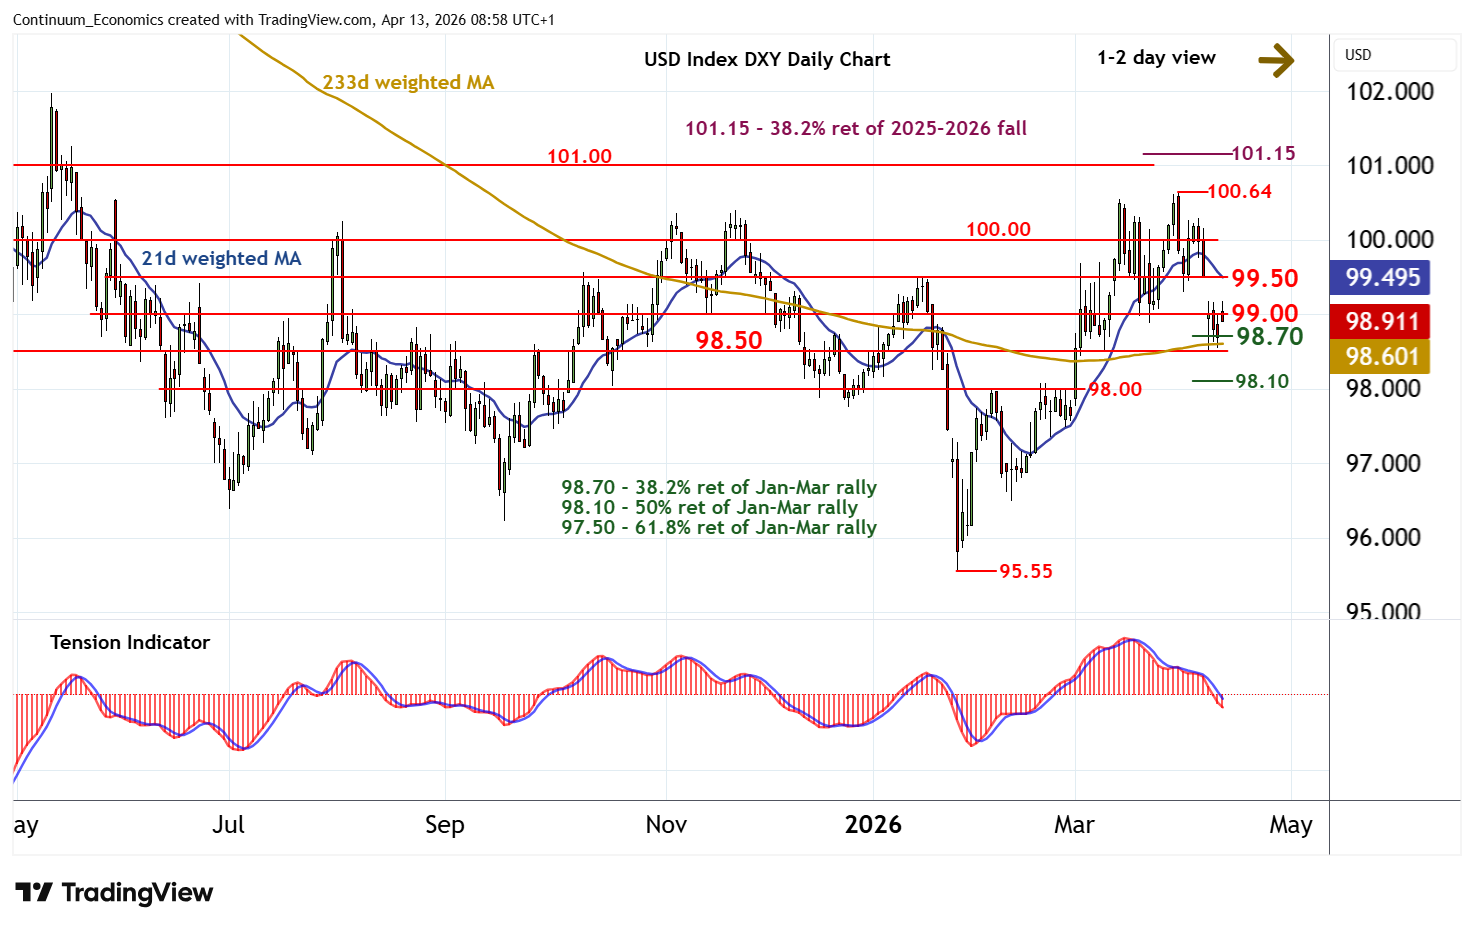
The opening gap higher has been pushed back from resistance at congestion around 99.00 and the 99.18 high of 8 April
| Levels | Imp | Comment | Levels | Imp | Comment | |||
|---|---|---|---|---|---|---|---|---|
| R4 | 100.30 | congestion highs | S1 | 98.70 | ** | 38.2% ret of Jan-Mar rally | ||
| R3 | 100.00 | ** | congestion | S2 | 98.50 | * | congestion | |
| R2 | 99.50 | * | congestion | S3 | 98.00/10 | ** | congestion; 50% ret | |
| R1 | 99.00/18 | ** | congestion; 8 Apr high | S4 | 97.50 | ** | congestion; 61.8% ret |
Asterisk denotes strength of level
08:50 BST - The opening gap higher has been pushed back from resistance at congestion around 99.00 and the 99.18 high of 8 April, with prices currently trading around 98.90. The negative daily Tension Indicator highlights room for a test of support at the 98.70 Fibonacci retracement and congestion around 98.50. But flattening oversold daily stochastics should limit any initial tests of this range in consolidation, before deteriorating weekly charts prompt further losses. Meanwhile, any immediate tests above 99.00/18 should meet selling interest towards congestion around 99.50.