Published: 2026-03-04T13:06:33.000Z
Chart USD/ZAR Update: Pullback to remain limited
1
Anticipated gains have extended to 16.7530, where unwinding overbought intraday studies are prompting a pullback
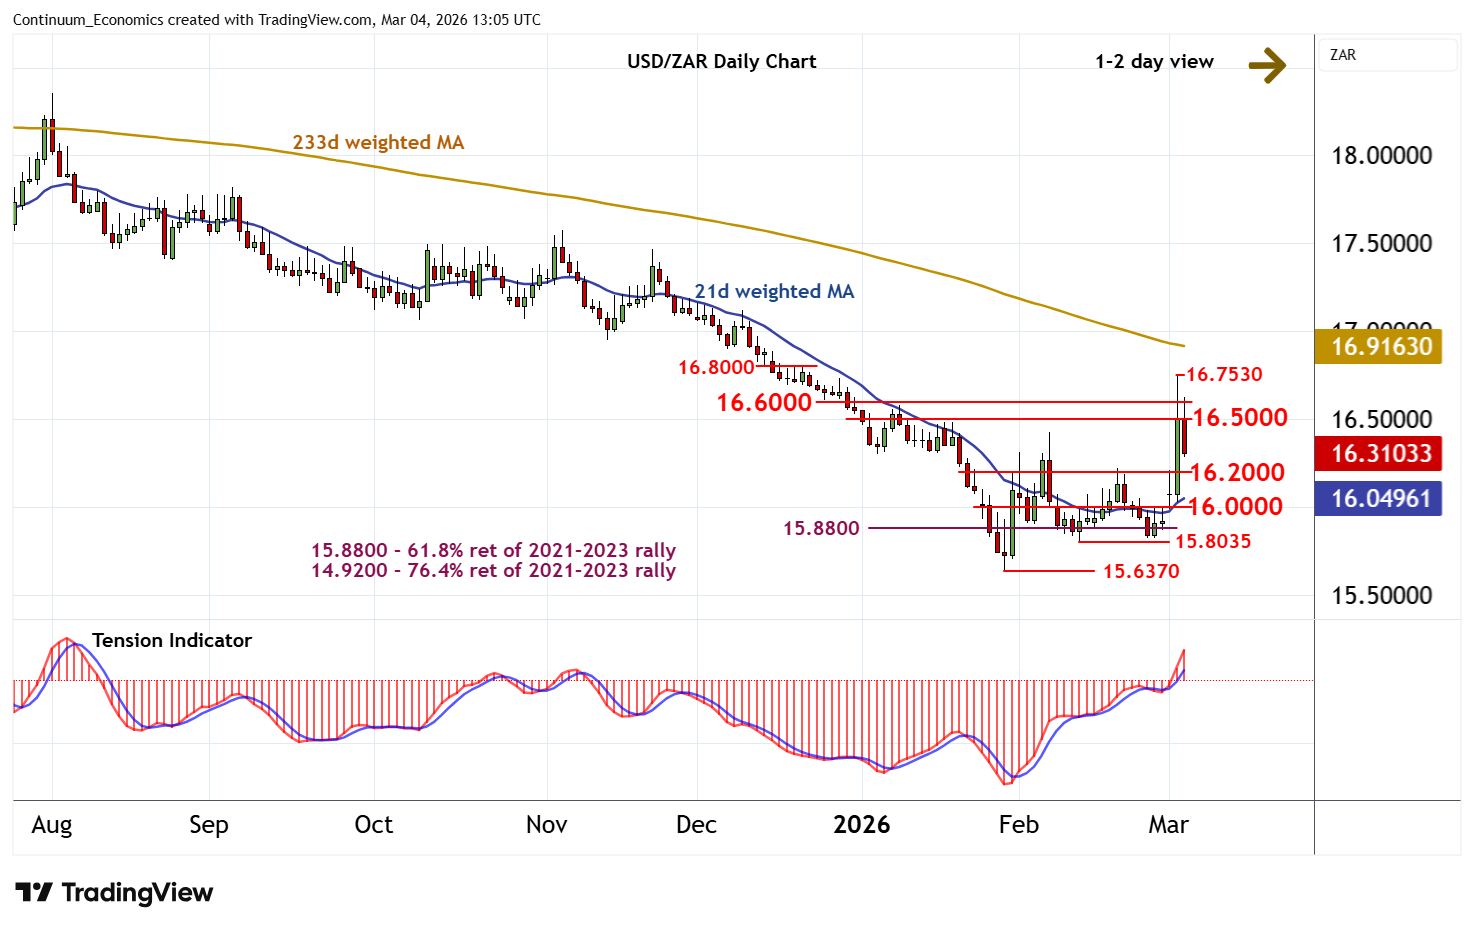
| Level | Comment | Level | Comment | |||||
|---|---|---|---|---|---|---|---|---|
| R4 | 16.8000 | * | break level | S1 | 16.2000 | * | congestion | |
| R3 | 16.7530 | 3 Mar high | S2 | 16.0000 | ** | congestion | ||
| R2 | 16.6000 | break level | S3 | 15.8035 | ** | 12 Feb (m) low | ||
| R1 | 16.5000 | break level | S4 | 15.6370 | ** | 29 Jan YTD low |
Asterisk denotes strength of level
12:40 GMT - Anticipated gains have extended to 16.7530, where unwinding overbought intraday studies are prompting a pullback. Steady selling interest is putting focus on congestion support at 16.2000. But rising daily readings and positive weekly charts should limit any break in renewed buying interest above further congestion around 16.0000. Following cautious/corrective trade, fresh gains are looked for. However, a close above resistance within the 16.5000 - 16.6000 range is needed to turn sentiment positive and extend late-January gains beyond 16.7530.