Published: 2025-02-20T08:14:17.000Z
Chart EUR/AUD Update: Extending losses

Technical Analyst
-
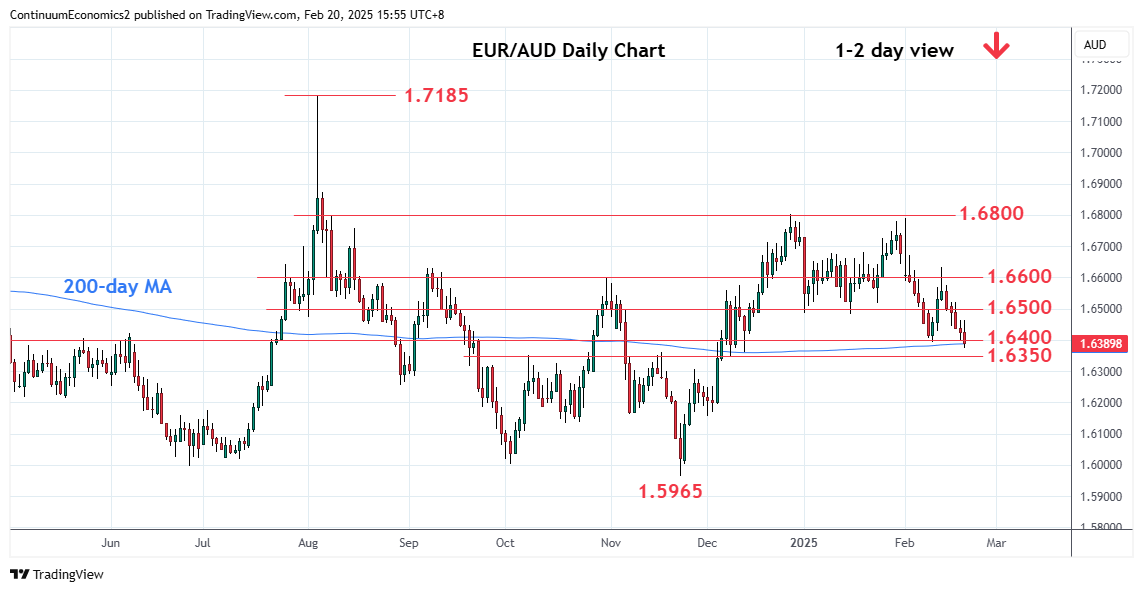
Extending losses from the 1.6633 high of last week to retest the 1.6400 support and 1.6385, 50% Fibonacci level
| Levels | Imp | Comment | Levels | Imp | Comment | |||
|---|---|---|---|---|---|---|---|---|
| R4 | 1.6790/00 | ** | 3 Feb YTD, Dec highs | S1 | 1.6385 | * | 50% Nov/Dec rally | |
| R3 | 1.6700 | * | congestion | S2 | 1.6350 | * | 9 Dec low | |
| R2 | 1.6600/33 | ** | congestion, 13 Feb high | S3 | 1.6300/85 | * | congestion, 61.8% | |
| R1 | 1.6500 | * | congestion | S4 | 1.6200 | * | congestion |
Asterisk denotes strength of level
08:10 GMT - Extending losses from the 1.6633 high of last week to retest the 1.6400 support and 1.6385, 50% Fibonacci level. The nagative daily and weekly studies seen weighing the break here will open up room for deeper retracement of the November/December rally. Lower will see extension to the strong support at the 1.6300/1.6285 congestion and 61.8% Fibonacci level. Meanwhile, resistance is lowered to the January lows at the 1.6480/1.6500 area which is now expected to cap bounce attempt and sustain losses from the 1.6800, double top.