Chart USD Index DXY Update: Limited tests lower
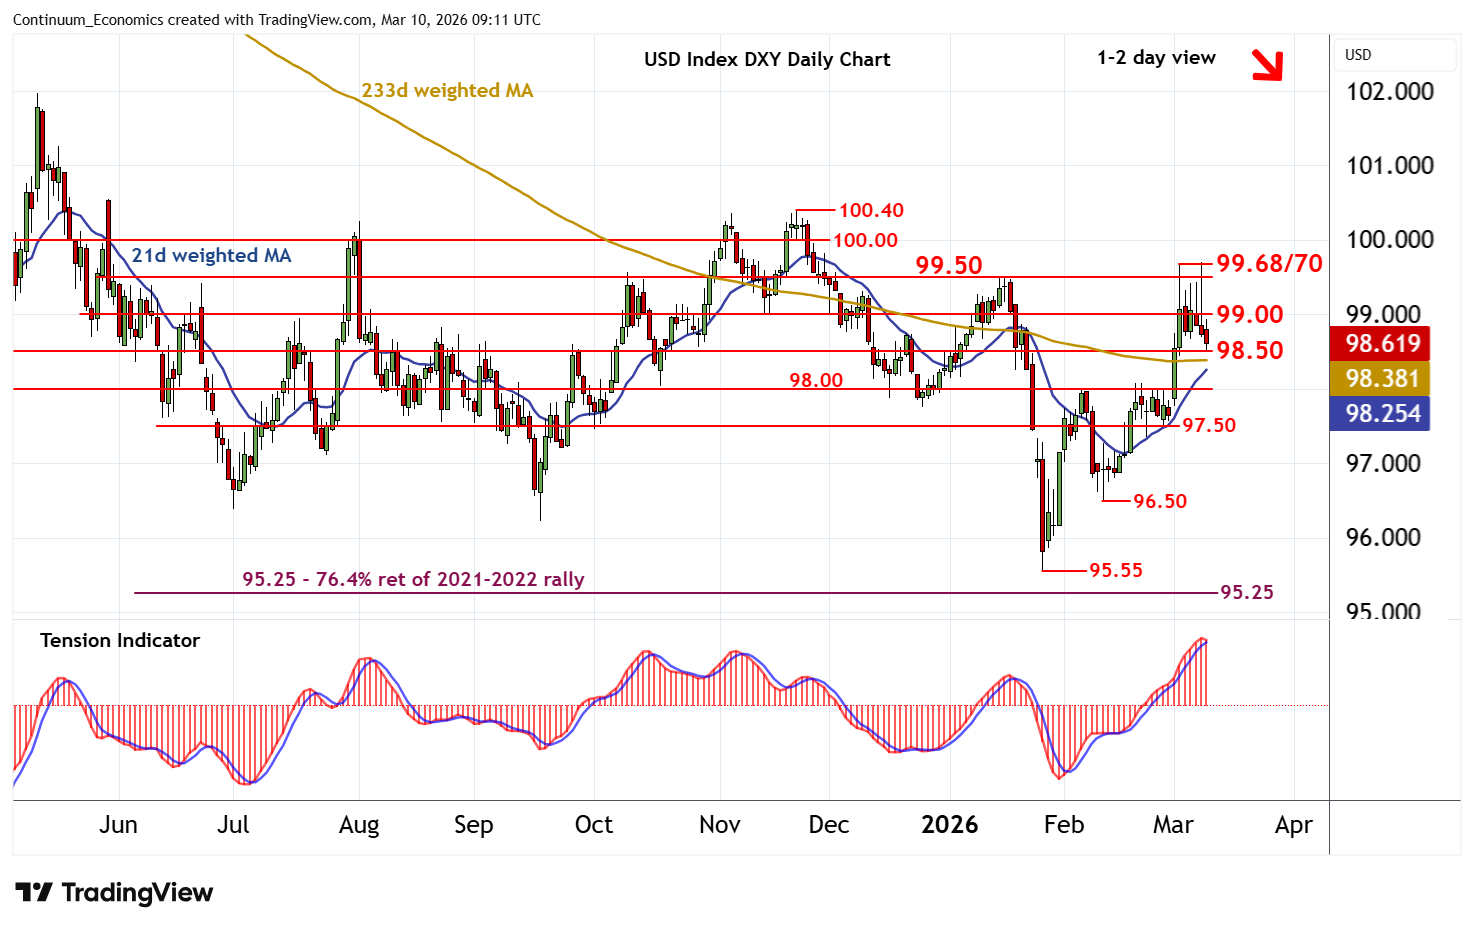
The test of resistance at 99.50 has given way to selling interest
| Levels | Imp | Comment | Levels | Imp | Comment | |||
|---|---|---|---|---|---|---|---|---|
| R4 | 100.00 | ** | congestion | S1 | 98.50 | * | congestion | |
| R3 | 99.68/70 | 3-9 Mar YTD high | S2 | 98.00 | * | congestion | ||
| R2 | 99.50 | ** | 15 Jan (m) high, cong | S3 | 97.50 | ** | congestion | |
| R1 | 99.00 | ** | congestion | S4 | 97.00 | * | congestion |
Asterisk denotes strength of level
08:50 GMT - The test of resistance at 99.50 has given way to selling interest, as intraday studies turn down, with the break below 99.00 putting focus on congestion support at 98.50. Overbought daily stochastics are turning down, unwinding negative divergence, and the positive daily Tension Indicator is also coming under pressure, highlighting room for a break below 98.50 towards further congestion around 98.00. Broader weekly charts continue to rise, however, suggesting any initial tests of here could give way to consolidation. Meanwhile, a close back above congestion resistance at 99.00 would help to stabilise price action and give way to consolidation beneath strong resistance within the 99.50 - 99.68/70 range.